Characteristics of Homes Built in Age-Restricted Communities
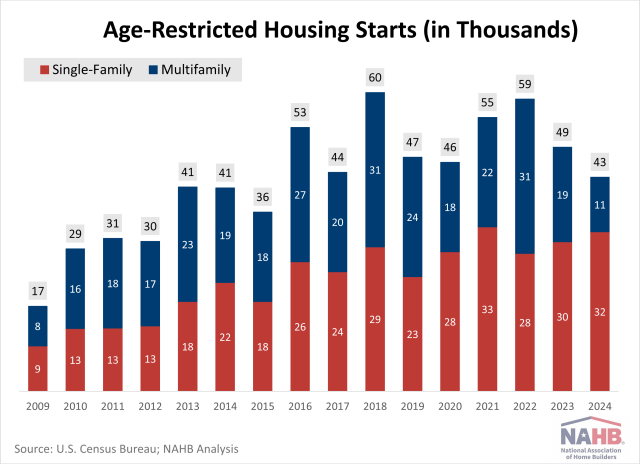
Web Master2025-09-29T09:19:49-05:00In 2024, approximately 43,000 homes were built in age-restricted communities, representing just over 3% of all housing starts. According to the Census Bureau’s Survey of Construction, roughly three-quarters of these homes (32,000) were single-family units. The remaining 11,000 were multifamily units, which marked the lowest number of age-restricted multifamily starts since 2009. In 2009, during the depths of the housing downturn, builders started only 17,000 homes in age-restricted communities (9,000 single-family and 8,000 multifamily). The numbers then increased steadily until reaching 60,000 age-restricted starts (roughly evenly split between single-family and multifamily) in 2018. These numbers decreased during the pandemic but rebounded in 2021-2022, almost reaching the peak from 2018. In 2024, the total number of age-restricted home starts decreased by approximately 12% from 2023. This drop came amid a broader slowdown in overall housing starts. While total single-family starts increased by about 7% year-over-year, multifamily starts fell sharply by 25%. A similar trend played out in the age-restricted segment: single-family starts increased, while multifamily starts declined. In terms of market share, age-restricted single-family homes maintained their 3.16% share of all single-family starts, but the share of age-restricted multifamily units fell to 3.11%. Age-restricted single-family homes carried a noticeable price premium in 2024. The median sales price reached $525,000—about 25% higher than the $421,000 median for non-age-restricted homes. While new non-age-restricted home prices held steady compared to the previous year, prices for age-restricted homes rose by 5%. Age-restricted homes tended to be larger, averaging 2,200 square feet versus 2,100 square feet. However, the price per square foot remained elevated at $155.90, compared to $154.30 for non-age-restricted homes. Lot values may help explain part of the price difference. Age-restricted homes were typically built on more expensive lots, with a median value of $62,000 compared to $60,000 for non-age-restricted homes. Despite the higher price, these lots were smaller, averaging 0.16 acres versus 0.20 acres. Additional data from the 2024 SOC reveal that age-restricted homes have distinct characteristics compared to non-age-restricted homes. A higher percentage of age-restricted homes are attached, single-story, and lack a basement. These homes are also more likely to come with patios and porches, but less likely to have decks. Finally, age-restricted homes are less likely to require a loan and more likely to be purchased for cash, as older home buyers have had longer to accumulate savings and assets (often equity in a previous home) that can be converted into cash. Discover more from Eye On Housing Subscribe to get the latest posts sent to your email.