The Fed Cuts amid Partly Cloudy Conditions
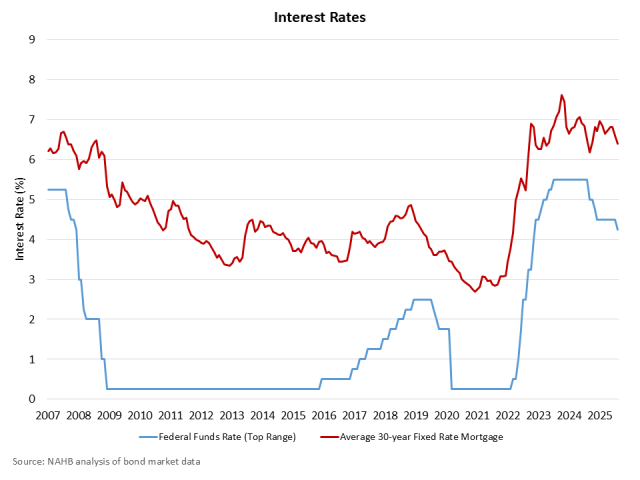
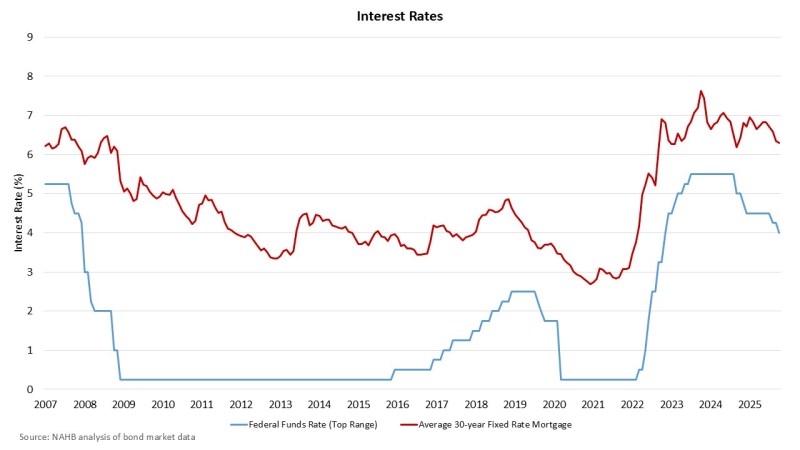
Web Master2025-10-29T14:19:05-05:00With the government shutdown limiting the quantity of economic data available to markets and policymakers, the central bank’s Federal Open Market Committee (FOMC) enacted a widely anticipated 25 basis point cut for the short-term federal funds rate. This marks the second consecutive cut this Fall, and the move decreases the policy rate to an upper rate of 4.25%. Reflecting that the market anticipated this policy move, long-term rates were relatively unchanged after the FOMC announcement. There were two dissenters to today’s decision, with new Fed Governor Miran voting no (preferring a larger 50 basis point reduction). Kansas City Fed President Schmid also voted no, but wanted no federal funds rate reduction. Chair Powell noted that there were “strongly differing” views at this meeting with respect to December policy action, with a possibility of no further cuts before the end of the year. Commenting on current economic conditions, the FOMC statement noted that “economic activity has been expanding at a moderate pace.” In his press conference, Chair Powell noted that activity in the housing market remains “weak.” As a justification for monetary policy easing, the FOMC stated that “job gains have slowed this year.” On the other side of the policy mandate, the Fed specified that “inflation has moved up since earlier in the year and remains somewhat elevated.” In a nod to some short-term liquidity concerns, the Fed also stated that it will conclude its quantitative tightening (QT) or balance sheet reduction program on December 1st. The Fed’s balance sheet has declined by more than $2.2 trillion during the course of this round of QT. However, the Fed will continue to allow mortgage-backed securities (MBS) to mature but reinvest those funds into Treasuries, which will allow the Fed to reduce net holdings of MBS while holding the size of the total balance sheet relatively constant. The Fed may also, in the future, reduce long-duration holdings in favor or more short-term debt. This presents a mixed view of possible impacts on mortgage interest rates from balance sheet actions. Current macro indicators, limited by data availability, present a cloudy or mixed picture. Layoffs are increasing. The two-year Treasury rate remains below the federal funds rate, suggesting ongoing tight policy. However, inflation remains above the Fed’s 2% target, stock and asset values continue to rise, and there are positive economic expectations from tax changes like expensing for business investment. Tariffs were not mentioned in the today’s statement, although Fed Governor Waller’s view that tariff impacts on domestic prices are likely to be one-off impacts has received more attention among market analysts and monetary policymakers. With respect to housing supply, in contrast to movement for long-term rates, the reduction of the federal funds rate will have a direct, beneficial effect on interest rates for acquisition, development and construction (AD&C) loans, the key financing channel for private builders who build more than 60% of single-family homes. This will reduce lending costs for builders across the nation and enable more attainable supply. Going forward, if labor market conditions continue to weaken, the Fed will continue to ease – at some point. However, future cuts are likely to be more hotly debated given the current rate of inflation. Chair Powell noted that there is “no risk free path for policy” in this kind of environment. Amid bifurcated market signals and economic conditions (particularly with respect to differentiated high income and low income consumer spending patterns), the vote at the December meeting will be contested. And the ongoing lack of data may cause the Fed to move more slowly as a precaution. Discover more from Eye On Housing Subscribe to get the latest posts sent to your email.