September Jobs Report Highlights a Cooling but Still Growing Labor Market
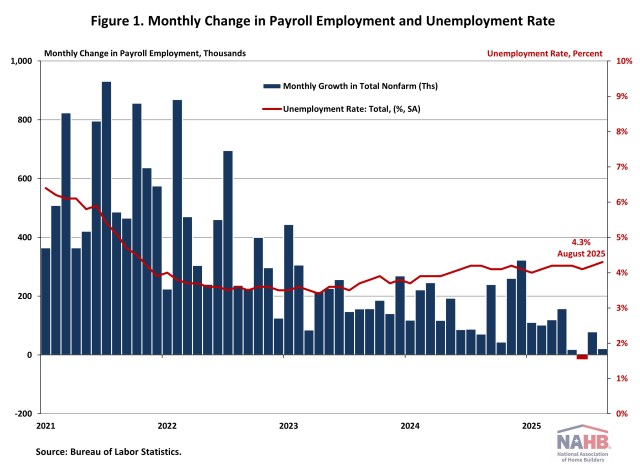
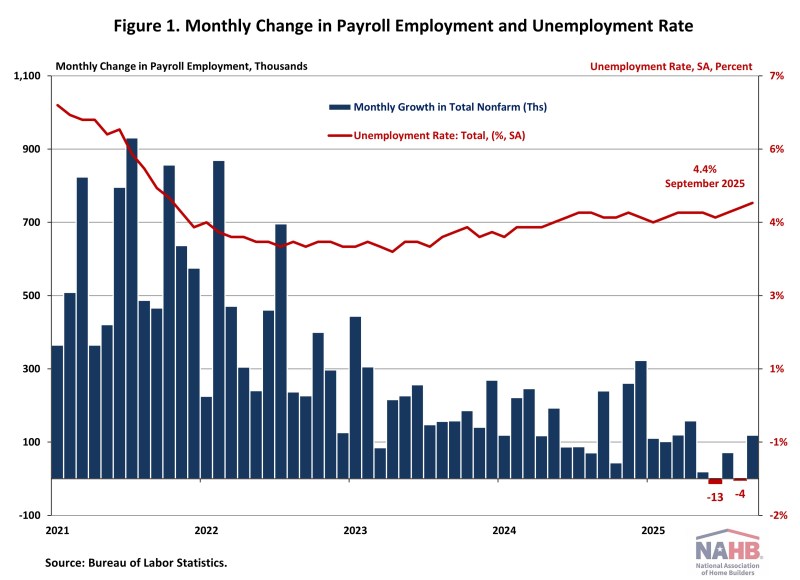
Web Master2025-11-20T12:16:21-06:00The long-delayed September jobs report revealed that the U.S. economy added 119,000 jobs while the unemployment rate climbed to its highest level in nearly four years. Combined with downward revisions to previous months, this month’s data indicates a slowing of the U.S. labor market, though one that is still expanding. With the October jobs report cancelled due to the government shutdown and November’s report not scheduled for release until December 16, this September report now stands as the Federal Reserve’s final look at labor market conditions before its December meeting. In September, wages grew at a 3.8% pace year over year, matching August’s increase. Wage growth has been outpacing inflation for nearly two years, which typically occurs as productivity increases. National Employment The September jobs report was delayed by more than six weeks due to the federal government shutdown. According to the long-awaited Employment Situation Summary reported by the Bureau of Labor Statistics (BLS), total nonfarm payroll employment rose by 119,000 in September, following a downwardly revised loss of 4,000 jobs in August. August’s growth was revised down by 26,000, from an initial estimate of +22,000 to -4,000, marking the second month of negative job growth since January 2010. July’s job growth was revised down by 7,000, from +79,000 to +72,000. Combined, the revisions erased 33,000 jobs from previously reported figures. Through September, monthly job growth in 2025 has averaged 76,000, a significant slowdown compared to the 168,000 monthly average gain for 2024. The unemployment rate rose to 4.4% in September, its highest level in nearly four years. The number of persons unemployed rose by 219,000 and the number of persons employed increased by 251,000. Meanwhile, the labor force participation rate—the proportion of the population either looking for a job or already holding a job—edged up by 0.1 percentage points to 62.4%. This remains below its pre-pandemic level of 63.3% recorded at the beginning of 2020. Among prime working-age individuals (aged 25 to 54), the participation rate remained steady at 83.7%, the highest level since October 2024. In September, employment gains were seen in health care (+43,000), food services and drinking places (+37,000), and social assistance (+14,000), while the transportation and warehousing sector and the federal government experienced job losses. Federal government employment fell by 3,000 positions in September and has now shed a total of 97,000 positions since peaking in January 2025. The BLS notes that “employees on paid leave or receiving ongoing severance pay are counted as employed in the establishment survey.” Construction Employment Employment in the overall construction sector increased by 19,000 in September, after three consecutive months of job losses. Within the industry, residential construction added 3,100 jobs, while non-residential construction gained 16,300 positions. Residential construction employment now stands at 3.3 million in September, including 954,000 workers employed by builders and remodelers and 2.4 million residential specialty trade contractors. The six-month moving average of job gains for residential construction remains negative at -3,767 per month, reflecting losses in four of the past six months for May through August 2025. Over the last 12 months, residential construction has seen a net loss of 44,900 jobs, marking the fifth consecutive annual decline since September 2020. Since the low point following the Great Recession, residential construction has gained 1,340,000 positions. In September, the unemployment rate for construction workers jumped to 5.1% on a seasonally adjusted basis. The unemployment rate for construction workers has remained at a relatively lower level, after reaching 15.3% in April 2020 due to the housing demand impact of the COVID-19 pandemic.