NAHB HBGI: Relative Gains for Smaller Markets, Particularly for Multifamily
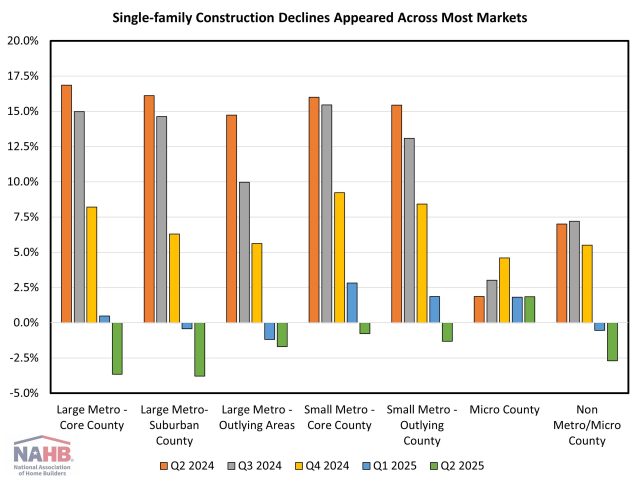
Web Master2025-09-02T09:21:24-05:00Single-family construction declined in the second quarter of 2025 for almost all tracked markets, according to the NAHB Home Building Geography Index (HBGI). Meanwhile, multifamily construction continued to expand in low population density markets, which have shown remarkable strength due to for-sale affordability challenges. The HBGI tracks single-family and multifamily permits across seven population density delineated geographies in the United States. Single-Family Home Building Among the HBGI markets, growth in the second quarter of 2025 was only registered in micro counties, which increased 1.8% year-over-year on a four-quarter moving average basis (4QMA). Most markets reported declines, with the largest occurring in large metro suburban counties, posting a decline of 3.8%. The drop in growth across the markets remains high, as five markets had single-family growth near 15% just one year ago. In terms of market share, single-family construction’s largest geography was small metro core county areas, representing 29.3% of single-family construction. The smallest single-family construction market remained non metro/micro county areas, with a 4.3% market share. As the largest declines in single-family construction over the past year occurred in large metro areas, smaller population and less densely populated counties have gained single-family construction market share. The combined market share of these smaller areas (excluding large metro areas), reached its highest level since the first quarter of 2023 (50.3%), marking 50.2% in the second quarter. Multifamily Home Building The largest gains for multifamily construction occurred in small metro outlying counties, growing 22.1% (4QMA) in the second quarter. This was the first time that small metro outlying counties had the largest gain among geographies since the second quarter of 2022, when it rose 29.6%. The largest decline was in large metro core counties declining 12.3%. The market share of multifamily construction for smaller markets has continued to climb since the pandemic. The loss in market share for large metro core counties, which continues to make up the bulk of multifamily construction, has mostly been absorbed by small metro core counties. The market share for small metro core counties is up 4.3 percentage points from the first quarter of 2020 to 24.9%. If this trend continues, small metro core counties could overtake large metro suburban counties for the second highest market share in the multifamily construction market as the gap between the two continues to shrink. The second quarter of 2025 HBGI data along with an interactive HBGI map can be found at http://nahb.org/hbgi. Discover more from Eye On Housing Subscribe to get the latest posts sent to your email.