Home Price Gains Continued in December
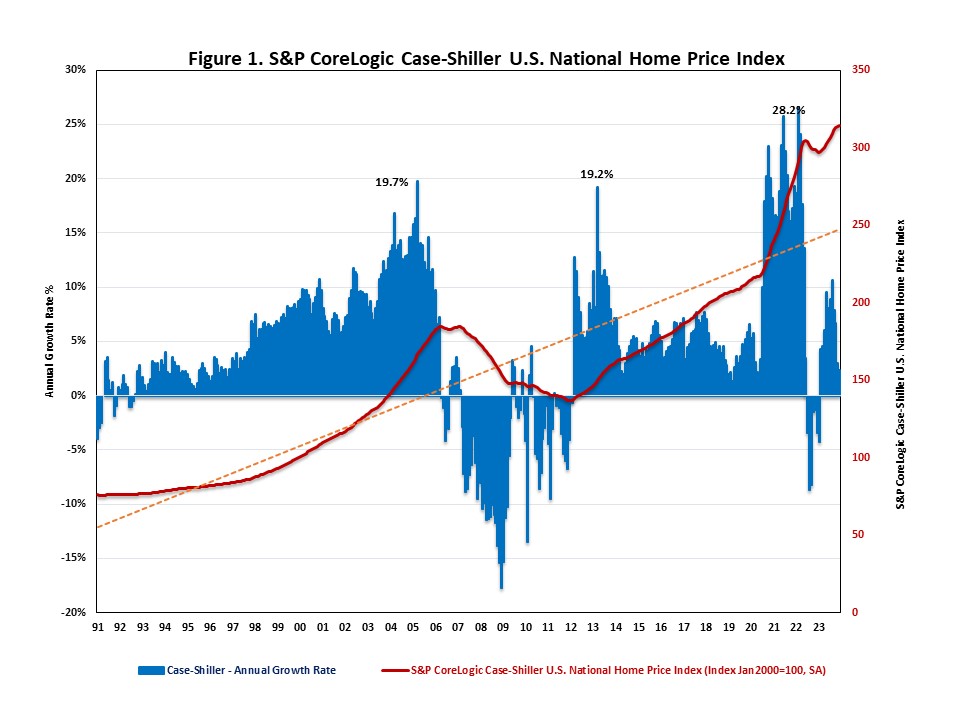
Jing Fu2024-02-27T12:16:32-06:00National home prices continued to increase, hitting a new all-time high in December. Despite high mortgage rates, limited inventory and strong demand continued to push up home prices. Locally, six of 20 metro areas, experienced negative home price appreciation in December. The S&P CoreLogic Case-Shiller U.S. National Home Price Index (HPI), reported by S&P Dow Jones Indices, rose at a seasonally adjusted annual growth rate of 2.4% in December, slower than a 3.0% increase in November. It marks the fourth straight month of deceleration since September. Nonetheless, national home prices are now 70% higher than their last peak during the housing boom in March 2006. On a year-over-year basis (YOY), the S&P CoreLogic Case-Shiller U.S. National Home Price NSA Index posted a 5.5% annual gain in December, up from a 5.0% increase in November. It was the highest year-over-year gain over the past twelve months. Home price appreciation slowed greatly over the past year; the average YOY home price gain for 2023 was 2.4%, after the double-digit gains seen in the previous two years. Home prices are stabilizing as more buyers and sellers enter the market. Meanwhile, the Home Price Index, released by the Federal Housing Finance Agency (FHFA), rose at a seasonally adjusted annual rate of 1.2% in December, following a 4.3% increase in November. On a year-over-year basis, the FHFA Home Price NSA Index rose 6.5% in December, down from 6.6% in the previous month. In addition to tracking national home price changes, S&P Dow Jones Indices also reported home price indexes across 20 metro areas in December on a seasonally adjusted basis. While six out of 20 metro areas reported negative home price appreciation, 13 metro areas had positive home price appreciation. Home prices for Cleveland (OH) were unchanged from the previous month. Their annual growth rates ranged from -2.7% to 10.1%. Among all 20 metro areas, 10 metro areas exceeded the national average of 2.4%. Las Vegas led the way with a 10.1% increase, followed by Los Angeles with an 8.6% increase and Miami with an 8.0% increase. The six metro areas that experienced price declines are Portland (-2.7%), Minneapolis (-1.6%), San Francisco (-1.4%), San Diego (-1.3%), Detroit (-0.6%) and Dallas (-0.6%). The scatter plot below lists the 20 major U.S. metropolitan areas’ annual growth rates in November and in December 2023. The X-axis presents the annual growth rates in November; the Y-axis presents the annual growth rates in December. Seven out of the 20 metro areas, the dots above the blue line, had an acceleration in home price growth, while the remaining 13 metro areas, located below the blue line, experienced deceleration. ‹ New Home Sales Up at the Start of 2024Tags: FHFA Home Price Index, home prices, S&P CoreLogic Case-Shiller Home Price Index