How to Create More Efficient Business Practices

2024-03-29T14:20:31-05:00

Builders and remodelers understand the importance of maximizing performance, efficiency and durability in their builds. In NAHB’s array of April online education courses, learn everything from how to optimize building envelopes to ways you can improve customer relations using contracts and law.

How to Create More Efficient Business Practices2024-03-29T14:20:31-05:00

2023 State-Level GDP Data

2024-03-29T14:20:44-05:00

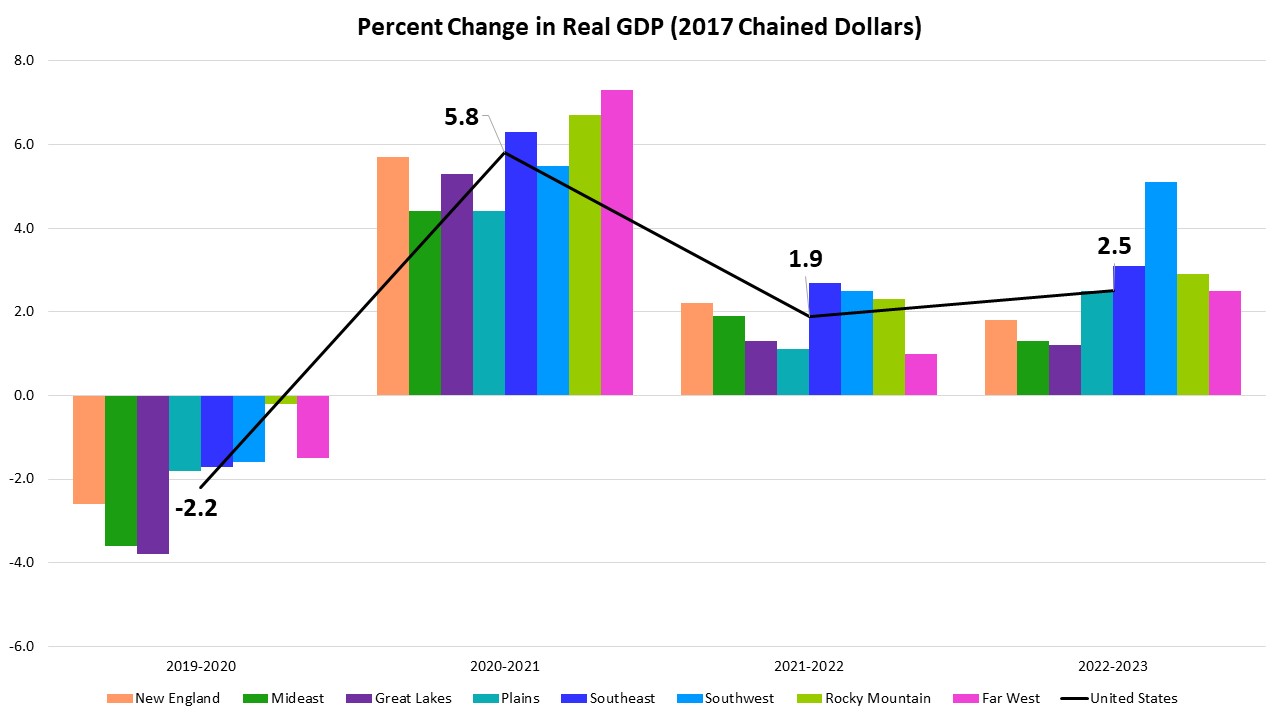
Real gross domestic product (GDP) increased in 49 states and the District of Columbia in 2023 according to the U.S. Bureau of Economic Analysis (BEA). Delaware is the only state to report an economic contraction last year. The percent change in real GDP ranged from a 5.9 percent increase in North Dakota to a 1.2 percent decline in Delaware. Nationwide, growth in real GDP (measured on a seasonally adjusted annual rate basis) increased 2.5 percent in 2023, which is stronger than the 2022 level of 1.9 percent. Retail trade; professional, scientific, and technical services; and health care and social assistance were the leading contributors to the increase in real GDP across the country. Regionally, real GDP growth increased in all regions between 2022 and 2023. The percent change in real GDP ranged from a strong 5.1 percent increase in the Southwest region (Arizona, New Mexico, Oklahoma, and Texas) to a 1.2 percent increase in the Great Lakes region (Illinois, Indiana, Michigan, Ohio, and Wisconsin). At the state level, seven states, including North Dakota, Texas, Wyoming, Alaska, Oklahoma, Nebraska, and Florida, posted real GDP increases of over 5.0 percent. On the other hand, the District of Columbia, Georgia, Mississippi, New York, and Wisconsin grew less than 1.0 percent in 2023 compared to 2022. Delaware posted a 1.2 percent annual decline in 2023. The mining industry was the leading contributor to growth in seven states including North Dakota, Texas, Wyoming, Alaska, and Oklahoma, the states with the first-, second-, third-, fourth-, and fifth-largest increases in real GDP, respectively. Retail trade increased in all 50 states and the District of Columbia. This industry was the leading contributor to growth in Florida which posted a 5.0 percent increase in real GDP. On the other hand, finance and insurance decreased in 43 states and the District of Columbia. The industry was the leading contributor to the decline in Delaware.

2023 State-Level GDP Data2024-03-29T14:20:44-05:00

Some Controversial Provisions of 2024 IECC are Changed on Appeal

2024-03-29T09:17:11-05:00

The International Code Council (ICC) announced last week the results of the appeals process for changes to the 2024 International Energy Conservation Code (IECC), which sets energy efficiency standards for residential and commercial buildings.

Some Controversial Provisions of 2024 IECC are Changed on Appeal2024-03-29T09:17:11-05:00

Understanding Today’s New Home Buyers

2024-03-27T14:21:44-05:00

An efficient home sales pitch tailored to match the life experiences and personality traits of the home buyer can make or break a sale. NAHB will host a live education course to detail the different buyer demographics, tastes and styles on the market today.

Understanding Today’s New Home Buyers2024-03-27T14:21:44-05:00

Home Prices Increase for January

2024-03-27T11:15:18-05:00

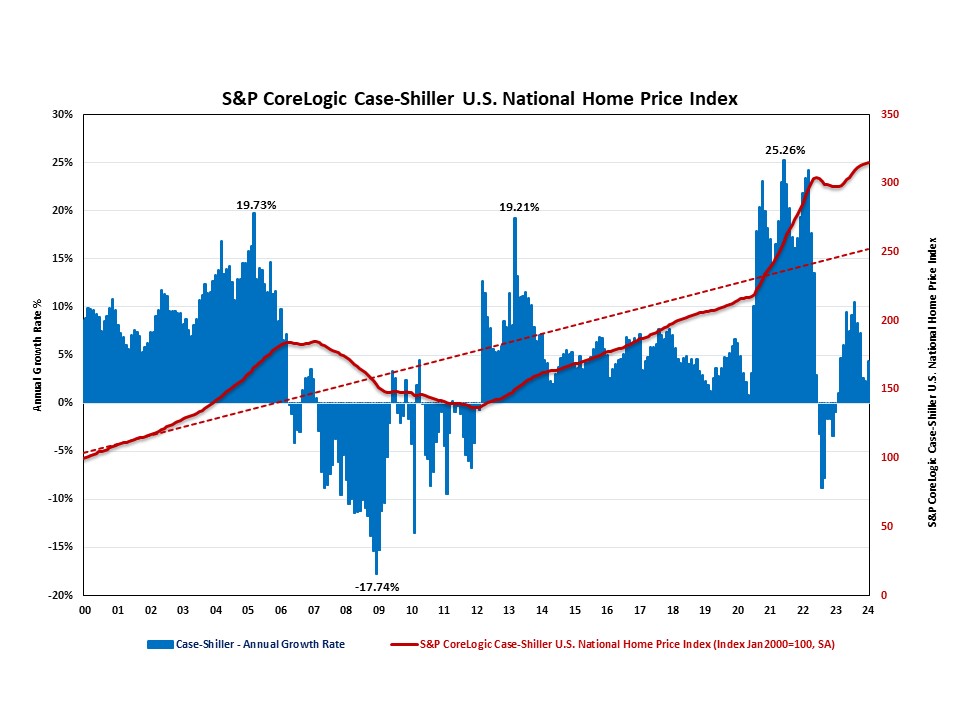
The S&P CoreLogic Case-Shiller U.S. National Home Price Index (HPI), reported by S&P Dow Jones Indices, rose at a seasonally adjusted rate of 4.36%. Although this rate has been slowing the previous four months, January saw its first uptick from 2.32% in December 2023.   On a year-over-year basis, the S&P CoreLogic Case-Shiller U.S. National Home Price NSA Index posted a 6.03% annual gain in January, following a 5.57% increase in December. The year-over-year rate has been increasing since May of 2023, and is at its highest since December of 2022.  Meanwhile, the Home Price Index released by the Federal Housing Finance Agency (FHFA), declined at a seasonally adjusted annual rate of -0.86% in January, following a 1.1% increase in December. On a year-over-year basis, the FHFA Home Price NSA Index rose 6.33% in January, down from 6.63% in the previous month.  In addition to tracking national home price changes, S&P Dow Jones Indices also reported home price indexes across 20 metro areas in January on a seasonally adjusted basis. While seven out of 20 metro areas reported negative home price appreciation, 13 metro areas had positive home price appreciation. Their annual growth rates ranged from -5.53% to 18.80%. Among all 20 metro areas, only four metro areas exceeded the national average of 4.36%. San Diego has the highest rate at 18.80%, followed by Washington, DC at 10.74%, and Charlotte with a 6.46% increase. The six metro areas that experienced price declines were Denver (-5.53%), Phoenix (-4.16%), Cleveland (-1.74%), Seattle (-1.47%), Portland (-1.37%), Detroit (-1.04%), and Miami (-.25%). 

Home Prices Increase for January2024-03-27T11:15:18-05:00

Agencies Take Action to Protect Wetlands, But Avoid Key WOTUS Questions

2024-03-27T10:14:27-05:00

Last week, the Army Corps of Engineers (Corps) issued a memo that highlights how the Corps will protect non-jurisdictional features through civil works and regulatory program actions following the Supreme Court’s decision in Sackett v. EPA. Despite these actions, however, uncertainty remains.

Agencies Take Action to Protect Wetlands, But Avoid Key WOTUS Questions2024-03-27T10:14:27-05:00

Coastal Construction: Outsized Multifamily Construction Compared to Single-Family

2024-03-27T07:18:55-05:00

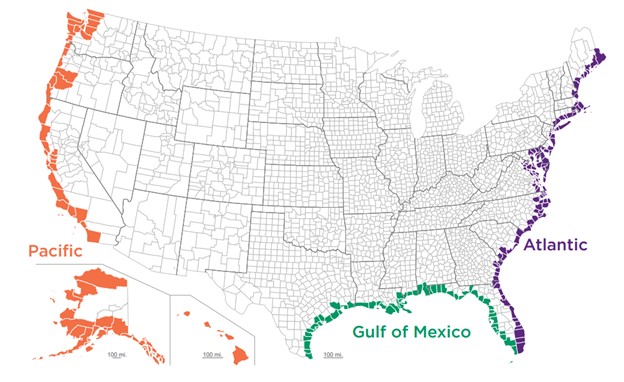
As part of the recently published HBGI, new NAHB analysis of residential permit data shows that about a quarter of single-family construction takes place in coastal counties. Coastal counties, as defined by U.S. Census Bureau, are counties that are adjacent to coastal water or a territorial sea. These coastal counties are grouped into three regions: the Atlantic, Gulf of Mexico, and Pacific. The four-quarter moving average market share (shown below) for single-family construction in coastal counties has marginally changed over the past nine years. The lowest market share occurred in the first quarter of 2021 at 23.09% of the market. After this minimum, the share rose to a peak of 25.01% in the second quarter of 2023. For the multifamily market, construction in coastal areas has been trending downward over the past nine years. The four-quarter moving average peaked during this period in the fourth quarter of 2015 at 43.51%. The share remained relatively level around 35% until 2021 when it began to descend. The current market share for coastal areas in the multifamily construction is 30.32%. While the coastal market share of multifamily construction has been falling recently, it has historically held a larger share compared to single-family coastal construction. Census estimates reveal that the seven densest populated counties (population per square mile) in the U.S. are coastal counties. Higher population density makes it difficult to construct single-family housing due to limited space availability, making multifamily construction the more economical option. Due to the population density of multiple coastal counties, demand for multifamily construction in coastal counties has been continually higher than that of single-family building.Additionally, the annual population share of coastal counties has remained relatively consistent at 28% of the total U.S. population. This share was at 28.72% in 2021 but has fallen very slightly over the past two years to 28.21% in 2023.

Coastal Construction: Outsized Multifamily Construction Compared to Single-Family2024-03-27T07:18:55-05:00

Consumer Confidence Remains Stable Despite Concerns About Future

2024-03-26T16:18:31-05:00

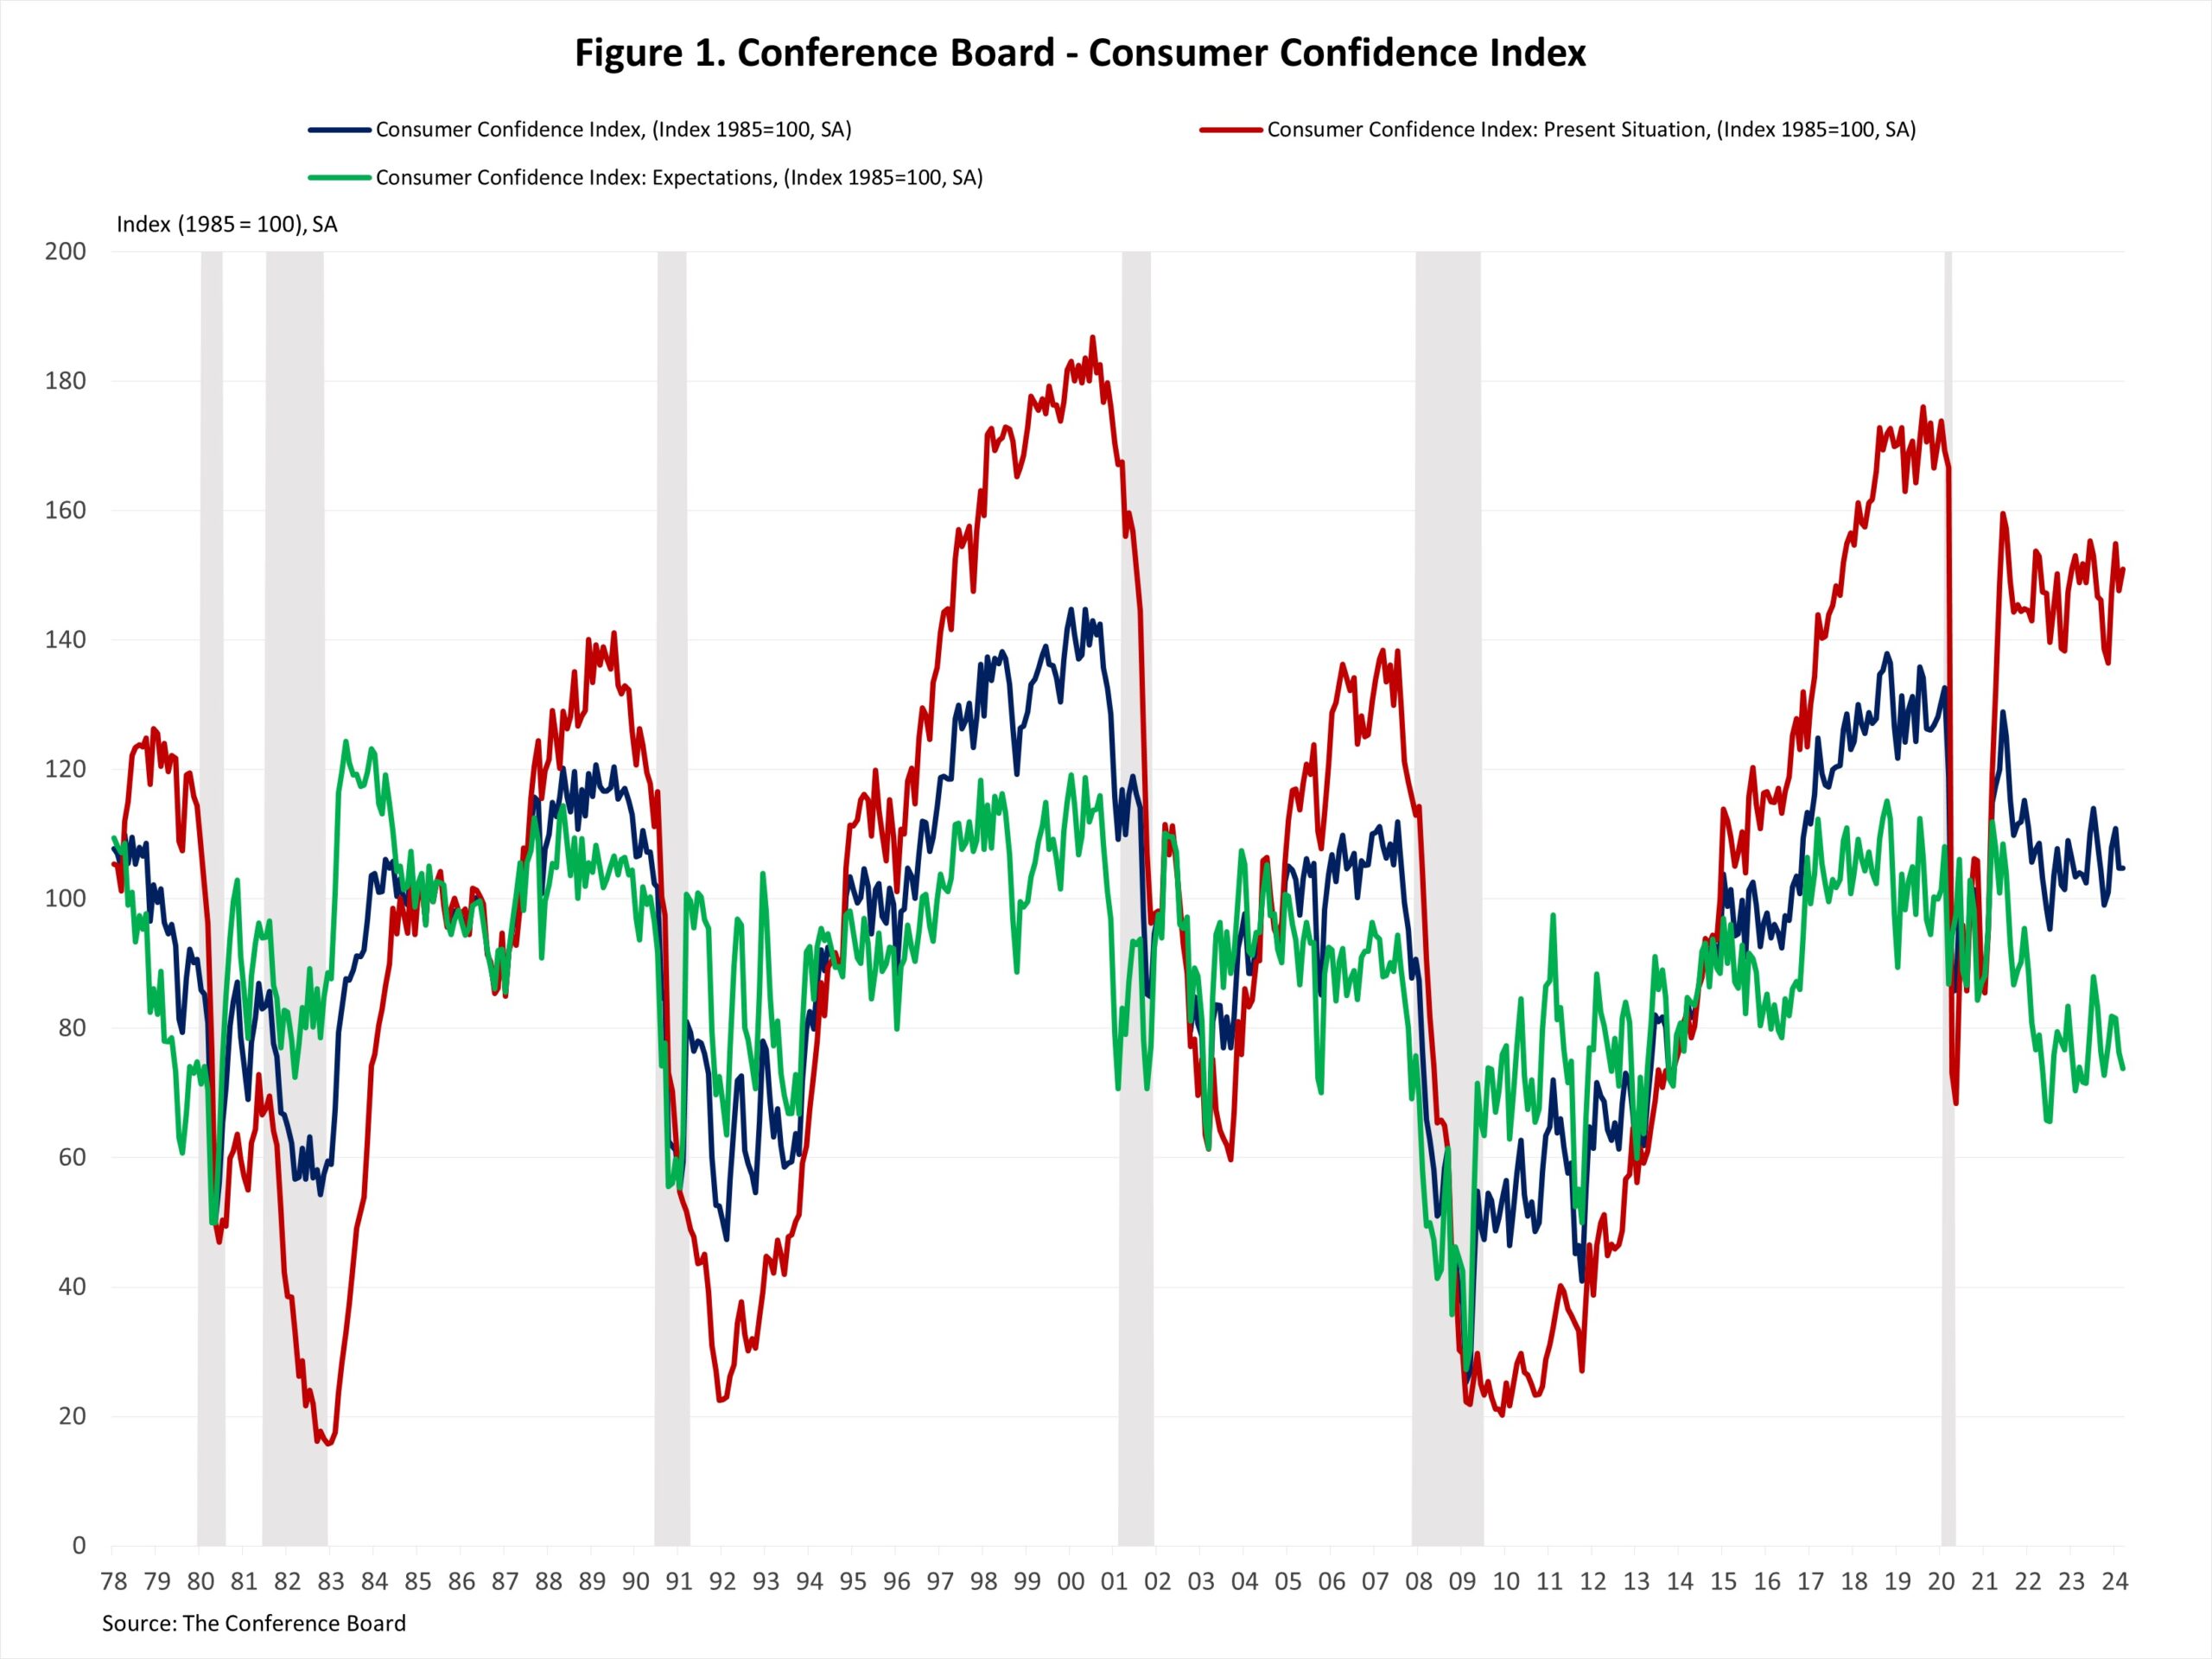
Consumer confidence held steady in March, with optimism about current conditions offset by concerns about the future economic outlook. This pessimism was primarily driven by persistent inflation, especially elevated food and gas prices. The Consumer Confidence Index, reported by the Conference Board, stood virtually unchanged at 104.7 in March, the lowest level since November 2023. The Present Situation Index rose 3.4 points from 147.6 to 151.0, while the Expectation Situation Index fell 2.5 points from 76.3 to 73.8. Historically, an Expectation Index reading below 80 often signals a recession within a year. Consumers’ assessment of current business conditions fell slightly in March. The share of respondents rating business conditions as “good” decreased by 0.9 percentage points to 19.5%, but those claiming business conditions as “bad” also fell by 0.5 percentage points to 17.2%. Meanwhile, consumers’ assessments of the labor market were more positive. The share of respondents reporting that jobs were “plentiful” increased by 0.3 percentage points, while those who saw jobs as “hard to get” fell by 1.8 percentage points. Consumers were more pessimistic about the short-term outlook. While the share of respondents expecting business conditions to improve rose from 14.0% to 14.3%, those expecting business conditions to deteriorate increased from 16.9% to 17.6%. Similarly, expectations of employment over the next six months were less favorable; The share of respondents expecting “more jobs” decreased by 0.2 percentage points to 13.9%, and those anticipating “fewer jobs” increased by 0.7 percentage points to 18.2%. The Conference Board also reported the share of respondents planning to buy a home within six months. The share of respondents planning to buy a home increased to 4.9% in March. Of those, respondents planning to buy a newly constructed home remained at 0.3%, and those planning to buy an existing home climbed to 2%.

Consumer Confidence Remains Stable Despite Concerns About Future2024-03-26T16:18:31-05:00

About My Work

Phasellus non ante ac dui sagittis volutpat. Curabitur a quam nisl. Nam est elit, congue et quam id, laoreet consequat erat. Aenean porta placerat efficitur. Vestibulum et dictum massa, ac finibus turpis.

Recent Works

Recent Posts