How Lumber Prices are Affecting Homebuilders
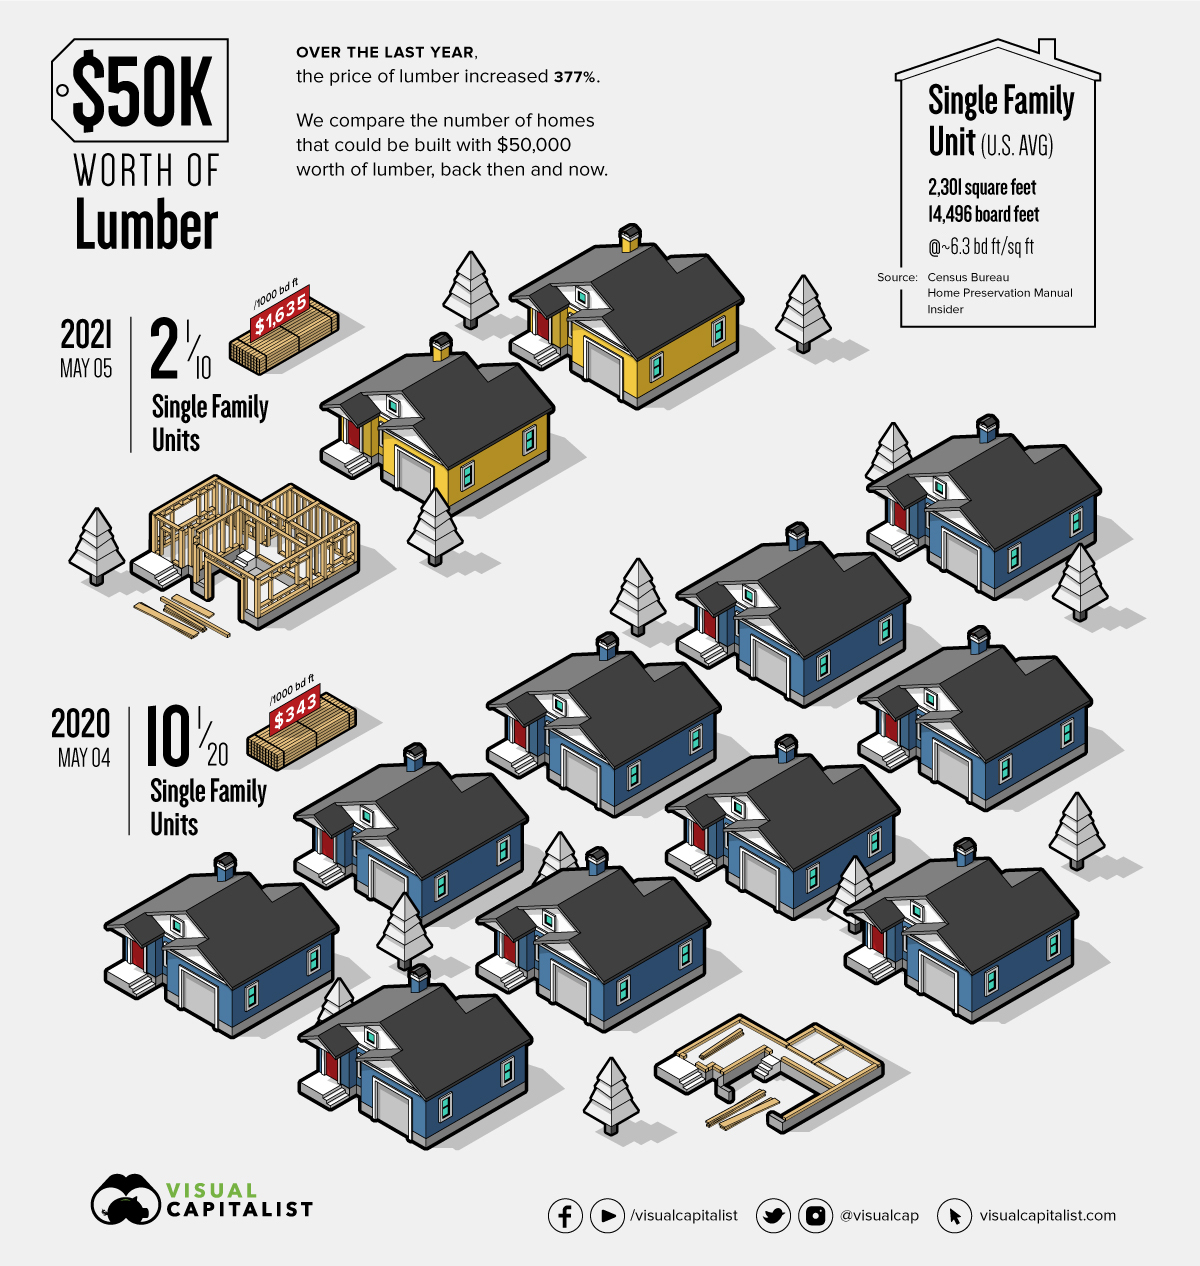
Diana Carroll2021-05-13T12:28:42-05:00They say a picture can tell a thousand words. Well, this new visual representation of the impact of lumber pricing on homebuilders certainly fits. Published on May 8th by Visual Capitalist, the amazing infographic shows the impact of lumber