Home Price Gains Weakened in December

2023-02-28T10:21:37-06:00

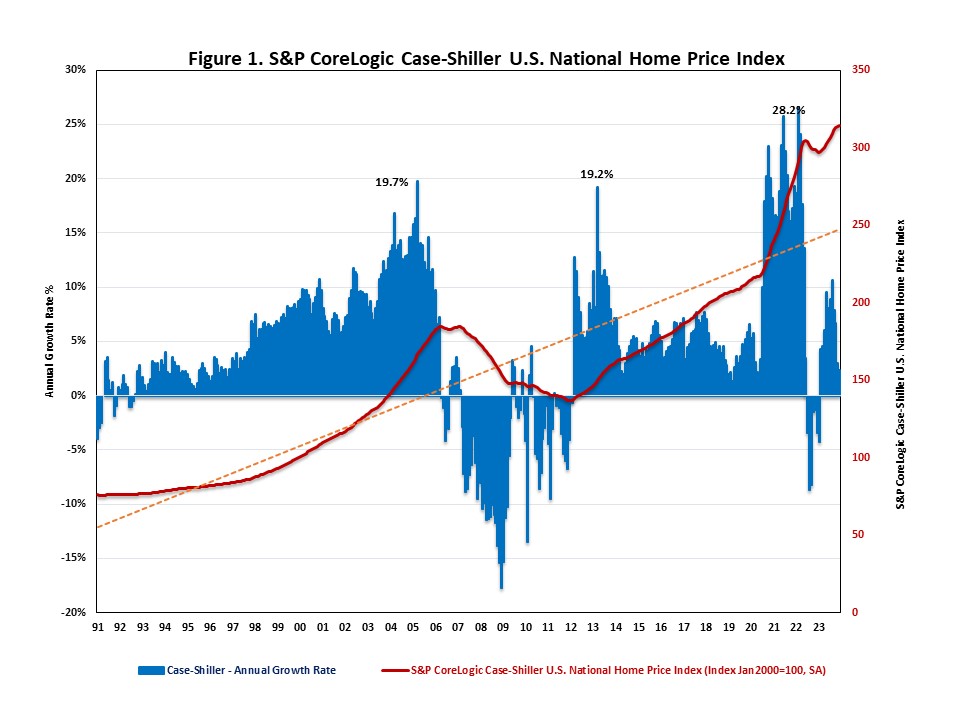
Seasonally adjusted home prices continued to fall in December and have declined for six consecutive months due to high mortgage rates and economic uncertainty. Locally, all 20 metro areas, reported by S&P Dow Jones Indices, experienced negative home price appreciation in December. The S&P CoreLogic Case-Shiller U.S. National Home Price Index, reported by S&P Dow Jones Indices, fell at a seasonally adjusted annual growth rate of 4.1% in December, following a 3.4% decline in November and a 2.8% decrease in October. After a decade of growth, home prices started to decline in July, driven by elevated mortgage rates and weakening buyer demand. The July decrease marked the first decline since February 2012, and this month’s decline marks the sixth consecutive monthly decline. Nonetheless, national home prices are now 61% higher than their last peak during the housing boom in March 2006. On a year-over-year basis, the S&P CoreLogic Case-Shiller U.S. National Home Price NSA Index posted a 5.8% annual gain in December, down from 7.6% in November. Year-over-year home price appreciation slowed for the ninth consecutive month as the monthly growth rates have turned negative. Meanwhile, the Home Price Index, released by the Federal Housing Finance Agency (FHFA), decreased at a seasonally adjusted annual rate of 1.2% in December, following a 1.4% decrease in November. On a year-over-year basis, the FHFA Home Price NSA Index rose by 6.6% in September, down from 8.2% in the previous month. The FHFA thus confirmed the slowdown in home price appreciation. In addition to tracking national home price changes, S&P Dow Jones Indices reported home price indexes across 20 metro areas in December. All 20 metro areas reported negative home price appreciation. Their annual growth rates ranged from -16.5% to -1.4% in December. Las Vegas, Phoenix, and Portland experienced the most monthly declines in home prices. Las Vegas declined 16.5%, while Phoenix and Portland declined 14.8% and 14.7%, respectively. The scatter plot below lists the 20 major U.S. metropolitan areas’ annual growth rates in November and in December 2022. The X-axis presents the annual growth rates in November; the Y-axis presents the annual growth rates in December.  Compared to last month, home prices declined faster in December in the following 11 metro areas: San Diego, Denver, Washington, DC, Miami, Chicago, Detroit, Minneapolis, Las Vegas, Cleveland, Portland, and Seattle. Related ‹ Apartment Absorption Rate Falls but Remains above 60%Tags: FHFA Home Price Index, home prices, S&P CoreLogic Case-Shiller Home Price Index

Home Price Gains Weakened in December2023-02-28T10:21:37-06:00

Market Share of All-Cash New Home Sales Hits 32-Year High

2023-02-17T15:19:39-06:00

NAHB analysis of the most recent Quarterly Sales by Price and Financing published by the U.S. Census Bureau reveals that cash purchases made 11.2% of new home sales in the fourth quarter of 2022—the largest share since 1990. The share of cash purchases has climbed each of the past four quarters and six of the last seven. Although the median prices of a new home held firm or increased across other financing types, the median cash price fell from $450,600 to $370,900 in the fourth quarter. On an annual basis, however, home prices climbed higher in 2022, regardless of financing type. Conventional loans financed 76.1% of new home sales, down 0.2 percentage point over the quarter but still near a 15-year high. The share of VA-backed sales decreased to 5.2% in the fourth quarter and has declined 1.0 ppt since Q2 2022. The FHA-backed share of new home sales fell to 7.5% in the fourth quarter—a 1.1 percentage point decline (quarter-over-quarter) and 3.0 ppts lower than Q4 2021.  Since the second quarter of 2020, the market share of FHA-backed sales has declined by nearly two-thirds. As conventional loan market share increases, the FHA share typically falls and vice versa. However, this dynamic broke down in 2022 as surging interest rates pushed borrowers to the sidelines and led to an increased share of all-cash sales. Between the first and fourth quarters of 2022, the total share of conventional and FHA-loan new home sales fell 2.6 percentage points while the share of cash sales increased by the same amount. Although cash sales make up a small portion of new home sales, they constitute a larger share of existing home sales. According to estimates from the National Association of Realtors, 28% of existing home transactions were all-cash sales in December 2022, up from 26.0% in November 2022 and 23.0% in December 2021. Price by Type of Financing Different sources of financing also serve distinct market segments, which is revealed in part by the median new home price associated with each. In the fourth quarter, the national median sales price of a new home was $467.700. Split by types of financing, the median prices of new homes financed with conventional loans, FHA loans, VA loans, and cash were $531,400, $330,200, $498,200, and $370,900, respectively. Between 2020 and 2022, the median price of a new home increased 35.0%–nearly five times the average two-year change dating back to 1990. The price of homes bought with FHA loans rose the most over that period (+37.9%), while the median price of a home purchased using a VA loan increased the least (+24.8%). Related ‹ Townhouse Construction Share Climbs to Near Four-Decade HighTags: FHA, FHA loans, financing, home prices, new home cash purchases, new home prices, new home sales, sales by financing, VA, VA loans

Market Share of All-Cash New Home Sales Hits 32-Year High2023-02-17T15:19:39-06:00

About My Work

Phasellus non ante ac dui sagittis volutpat. Curabitur a quam nisl. Nam est elit, congue et quam id, laoreet consequat erat. Aenean porta placerat efficitur. Vestibulum et dictum massa, ac finibus turpis.

Recent Works

Recent Posts