The Housing Crisis Ignites Action in State Houses
Diana Carroll2024-04-29T13:14:28-05:00State lawmakers share the details of legislative proposals to address the housing supply shortage.
State lawmakers share the details of legislative proposals to address the housing supply shortage.
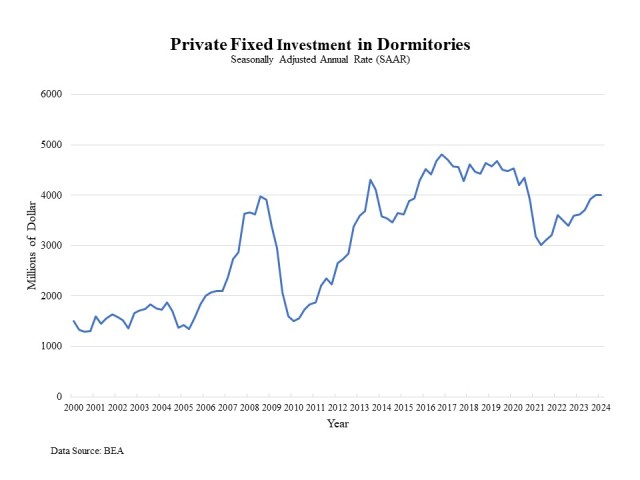
According to the data released by Bureau of Economic Analysis (BEA), private fixed investment in student dormitories edged down 0.1% to a seasonally adjusted annual rate (SAAR) of $4 billion in the first quarter of 2024, after a 2.3% increase in the prior quarter. Private fixed investment in dorms was 10.4% higher than a year ago, but still slightly below the pre-pandemic level. Private fixed investment in student housing experienced a surge after the Great Recession, as college enrollment increased from 17.2 million in 2006 to 20.4 million in 2011. However, during the pandemic, private fixed investment in student housing declined drastically from $4.47 billion (SAAR) in the last quarter of 2019 to a lower annual pace of $3.01 billion in the second quarter of 2021, as COVID-19 interrupted normal on-campus learning. College enrollment fell by 3.6% in the fall of 2020 and by 3.1% in the fall of 2021, according to the National Student Clearinghouse Research Center. Student housing private investment is on the road to recovery as the pandemic has ended. In-person learning requires college students to return to campuses, boosting the student housing sector. Discover more from Eye On Housing Subscribe to get the latest posts to your email.
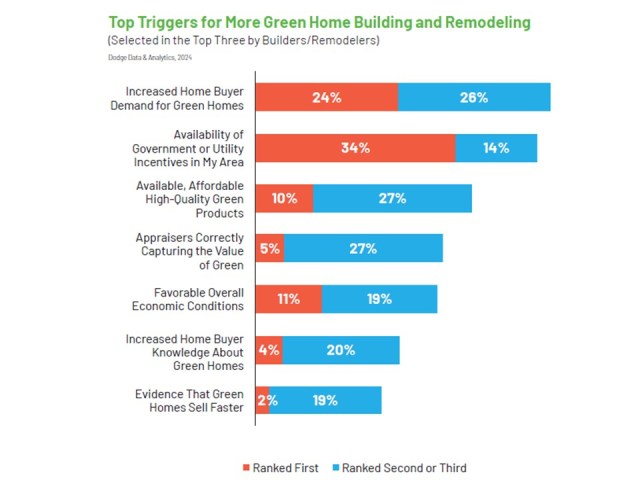
Building upon our exploration of green building trends, major practices, and resilience strategies based on The Building Sustainably: Green & Resilient Single- Family Homes 2024 SmartMarket Brief, this article now shifts focus towards ways to increase green building within the housing market. Top Incentives to Build Green The survey asked all respondents to select the top three factors that would increase their engagement with green building in the future. Half of respondents listed increased home buyer demand for green homes in their top three reasons. The second highest at 48% was availability of government or utility incentives in my area. Third, at 37%, was available, affordable high-quality green products. Methods of Showcasing Green Homes Home builders and remodelers who have built green projects were asked if they utilized any of the six approaches provided to demonstrate their projects were green. The top method was using a Home Energy Rating System (HERS) score at 39%. This was followed by website marketing at 35%, which had notable regional differences. Website marking was most used in the Northeast (60%), then the Midwest (52%) and West (43%), but it was least common in the South (20%). The other four approaches listed were: third-party certification (34%), MLS information (33%), silent salesperson signage (20%), and green appraisal form (6%). Terms for Describing Green Features Home builders and remodelers who do green home projects were asked to rank the three most effective terms for talking to their customers about green-related features from a list of 12 options. The most effective term was “High Performance” at 49%. The second highest at 46% was “Quality Construction” while third, at 44%, was “Operating Efficiency”. The complete rankings are shown in the chart below. Home Appraisals Home builders and remodelers were asked how frequently home appraisals accurately reflect the added value of a green home. The majority of respondents (60%) reported that they never see this occur. The second highest were those that said infrequently at 22%. Notably, there are no significant differences between the responses of builders and remodelers or the respondents from the four regions. This suggests accurate home appraisals are a significant challenge across the green building industry. MLS Listings Home builders and remodelers were also asked about the frequency with which green features are reflected in MLS listings, the database used by realtors for home sales. Less than one-third (31%) listed never, comparatively less than with home appraisals. However, infrequently was listed at 41%. In order for builders to supply green homes, there needs to be a home buyer demand. As we have seen, the prevalence of green home construction has seen little growth over the past few years. Contributing to this is the fact that consumers are not able to reliably compare homes with green elements to those without them. This is seen when green home appraisals and listings do not accurately reflect the added value of green building. The sustainability & green building industry faces headwinds to gain appropriate recognition from consumers about the advantages of green homes. Discover more from Eye On Housing Subscribe to get the latest posts to your email.
For any business to grow and maintain success, owners and managers need to understand how every aspect of the operation aligns with the core business. The latest installment of NAHB’s BizTools Video Series illustrates how to use a business model canvas to visualize key priorities more clearly.
In the latest episode of NAHB’s podcast, Housing Developments, hosts CEO Jim Tobin and COO Paul Lopez are once again joined by Tom Ward, vice president of legal advocacy, to discuss the outcome of the Supreme Court’s Sheetz decision and the National Association of Realtors (NAR) settlement.
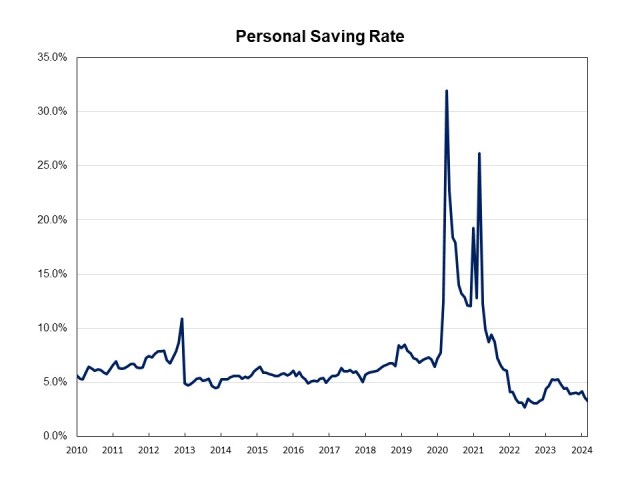
The most recent data release from the Bureau of Economic Analysis (BEA) showed that personal income increased 0.5% in March, up from a 0.3% increase in the prior month. Gains in personal income are largely driven by increases in wages and salaries. As spending outpaced personal income growth, the March personal savings rate dipped to 3.2%. This is 0.4 percentage points lower than the February reading and down by nearly two percentage points from last year. As inflation has almost eliminated compensation gains, people are dipping into savings to support spending. This will ultimately lead to a slowing of consumer spending. Real disposable income, income remaining after adjusted for taxes and inflation, edged up 0.2% in March, up from a dip of 0.1% in February. On a year-over-year basis, real (inflation adjusted) disposable income rose 1.4%. The pace of real personal income growth slowed after reaching 5.3% year-over-year gain in June of 2023. Personal consumption expenditures (PCE) rose 0.8% in March after a 0.8% increase in February. Real spending, adjusted to remove inflation, increased 0.5% in March, with spending on goods rising 1.1% and spending on services up 0.2%. Discover more from Eye On Housing Subscribe to get the latest posts to your email.
In a move that will curb new construction and harm housing affordability nationwide, the U.S. Department of Housing and Urban Development (HUD) and U.S. Department of Agriculture (USDA) have issued a final determination that will require all HUD- and USDA-financed new single-family construction housing to be built to the 2021 International Energy Conservation Code (IECC) and HUD-financed multifamily housing be built to 2021 IECC or ASHRAE 90.1-2019.
The U.S. Department of Labor (DOL) issued a final rule significantly increasing the salary level for determining overtime pay requirements for certain salaried employees.
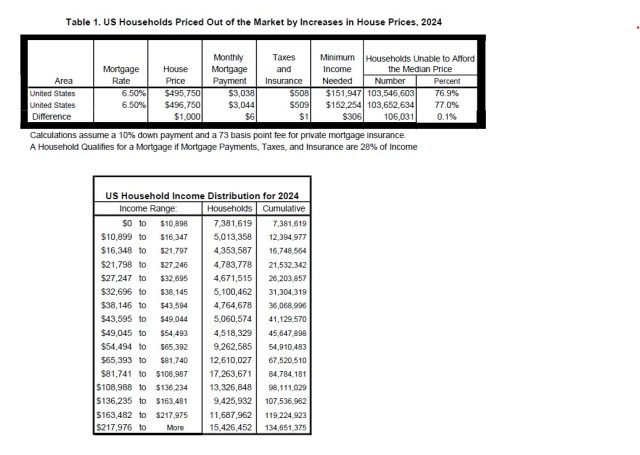
NAHB recently updated its 2024 priced out estimates, showing how higher prices and interest rates affect housing affordability. The new estimates show that affordability is a serious problem even before any further price or interest rate increases. Already in 2024, 103.5 million households are not able to afford a median priced new home ($495,750[1]). This is because their incomes are insufficient to qualify for the required mortgage under standard underwriting criteria. If the median new home price goes up by $1,000, an additional 106,031 households would be priced out of the market. The underwriting criterion used to determine affordability is that the sum of mortgage payments, property taxes, homeowners and private mortgage insurance premiums (PITI) during the first year is no more than 28 percent of the household’s income. Key assumptions include a 10% down payment, a 30-year fixed rate mortgage at an interest rate of 6.5%, and an annual premium starting at 73 basis points for private mortgage insurance. The 2024 priced-out estimates for all states and the District of Columbia and over 300 metropolitan statistical areas are shown in the map below. This map shows detailed information, including the projected 2024 median new home price estimates and the minimum income to secure a mortgage, and the percentage of households unable to afford the new homes. It also shows how a $1,000 increase in price could impact the number of households. Vermont stands out as the state with the highest share of households unable to afford the median-priced new home before any price changes, with approximately 92% of its households falling short on the income needed for a mortgage to buy a median-priced new home. Connecticut and Hawaii follow closely, with 89% and 88.5% of households respectively, facing similar affordability challenges for new homes at the median prices. On the other hand, Virginia is the state with much better affordability, where the median new home price is $462,000, however, around 66% of households still find these new homes unaffordable. San Jose-Sunnyvale-Santa Clara metro area in California stands out due to its exceptionally high median new home price of $1,685,593, requiring a minimum household income of $487,773. This makes it the metro area with the highest percentage of households unable to afford the median-priced new homes. In contrast, the Washington, DC metro area presents a more accessible market, where around 37% households are capable of purchasing new median-priced homes. This indicates a relatively higher level of affordability compared to San Jose metro area. More details, including priced out estimates for every state and over 300 metropolitan areas, and a description of the underlying methodology, are available in the full study. [1] The 2024 US median new home price is estimated by projecting the 2022 preliminary median new home price using the NAHB forecast of the Case-Shiller Home Price Index. Discover more from Eye On Housing Subscribe to get the latest posts to your email.
A recent report authored by the UCLA Lewis Center for Regional Policy Studies notes that although inclusionary zoning can help increase housing for low-income families, the mandates also suppress overall housing production if taken too far.