Where Renters and Owners Face the Highest Cost Burdens
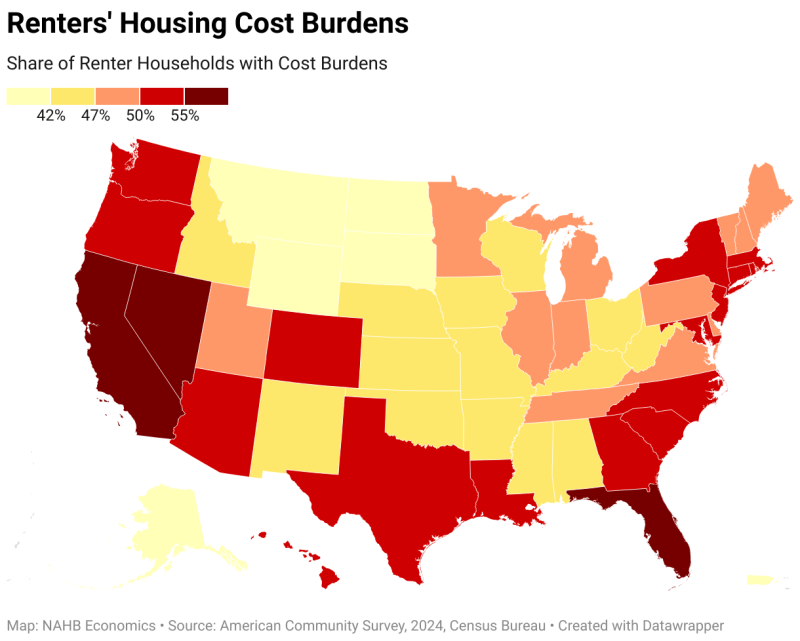
Web Master2025-11-24T11:16:25-06:00The housing affordability crisis continues to disproportionately affect renters, with more than half of renter households experiencing high-cost burdens — i.e., paying 30% or more of their income on rent and utilities. At the same time, current home owners, buoyed by significant home equity gains and locked in by below-market mortgage rates, are in a more advantageous financial position to weather the growing affordability crisis. According to the latest 2024 American Community Survey (ACS), more than half of all renter households (50.3%), or 23.2 million, are burdened by housing costs. Among home owners, this share is less than a quarter (24.3%) representing 21 million households. As a result, states and counties with higher shares of renters in their housing markets are more likely to have higher overall shares of households with cost burdens. Geographically, Florida, Nevada, and California have the largest concentration of cost-burdened renters. In Florida, 60% of all renters pay more than 30% of their income on rent and utilities. In Nevada, the share is 57%, and in California, 55% of renters experience housing cost burdens. Even in states with comparatively low renter cost-burden rates—such as South Dakota, Alaska, and North Dakota—more than one-third of renters still spend 30% or more of their income on housing. For home owners, cost-burden rates are generally lower, but the geographic pattern mirrors that of renters. California, Florida, and several Northeastern states report the highest shares of cost-burdened home owners. California faces the most severe affordability challenges, with one in three owners paying more than 30% of their income for housing. Florida and Hawaii follow closely, with 31% of existing home owners struggling to afford their homes. At the opposite end of the spectrum, nine states in the Midwest and South report that fewer than 20% of homeowners are cost-burdened. West Virginia and North Dakota have the lowest rates, at just 16%.