Number of Bathrooms in New Single-Family Homes in 2024
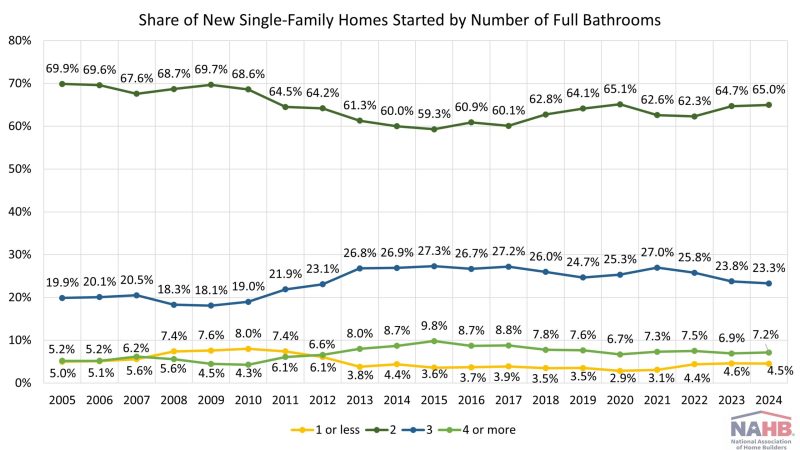
Web Master2025-12-04T09:15:50-06:00Single-family homes started in 2024 typically had two full bathrooms, according to the U.S. Census Bureau’s Annual Survey of Construction. Homes with three full bathrooms continued to have the second largest share of starts at around 23%. Meanwhile, both homes with four full bathrooms or more and homes with one bathroom or less made up under ten percent of homes started. A full bathroom, as defined by the Bureau, is one that has a washbasin, a toilet and either a bathtub or shower, or a combination of a bathtub and shower. In 2024, 65.0% of new single-family homes started in 2024 had two full bathrooms, marking the second consecutive year that this share has increased. The share of single-family starts with three full bathrooms fell for the third straight year, down to 23.3%, while the share of single-family starts with four or more bathrooms increased to 7.2%. For starts with one full bathroom or less, the share fell to 4.5%. Across the U.S., the East South Central division had the highest share, 71.6%, of new single-family starts having two full bathrooms. No other division had above a 70% share. The Census division with the lowest share was the Middle Atlantic, with 52.0% of new single-family starts reporting two full bathrooms. Starts in Middle Atlantic division were far more likely to have 4 full bathrooms or more, at 20.2%, more than double any other division in terms of share. Half-Bathrooms Most new single-family homes started in 2024 had no half-bathrooms at 53.7%. Following closely is the share of new single-family homes with one half-bathroom at 44.9%. New single-family starts with two or more half-bathrooms had a small share of 1.4% in 2024. A half bathroom contains a toilet, bathtub, or shower, but not all facilities to be classified as a full bathroom. Half-bathrooms are historically more prevalent in the New England Census division as compared to the other eight divisions. In 2024, 64.0% of new single-family homes started in the New England division had at least one half-bathroom. The lowest share occurred in the Pacific division, where only 38.3% of starts had at least one half-bathroom.