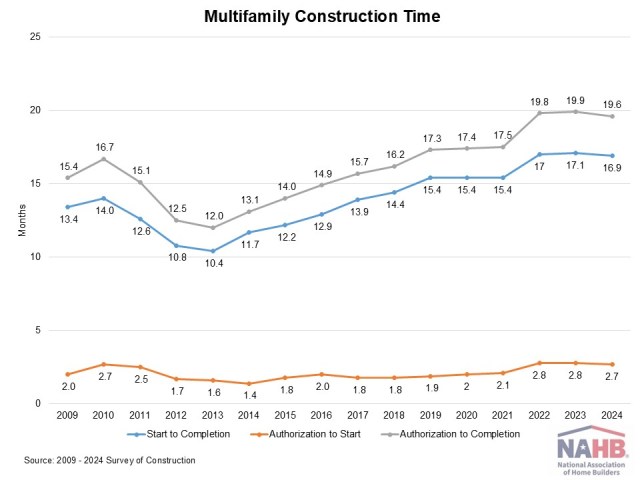
Green Building: Resiliency Practices

2024-04-22T10:15:33-05:00

Green homes go beyond lessening their environmental impact; they also actively mitigate the effects of the environment upon them. All homes can face damage from environmental hazards, prompting builders to implement resiliency practices to reduce such risks. This post will detail the prevalence of resiliency building, specific practices by hazard, as well as resiliency certification systems. This is a follow up to the previous posts about the prevalence of green building and green building practices, based on the The Building Sustainably: Green & Resilient Single- Family Homes 2024 SmartMarket Brief.  Prevalence   The most common natural hazards can be broken into five categories: wind, flood, fire, earth, and temperature. Three quarters of builders say they mitigate for at least one of these five hazards. Expectantly, there is a difference by region in those that mitigate at least one of the five hazards. The highest percentage is the West at 84%, then the South at 77%, followed by the Midwest at 69%, lastly the Northeast at 66%. Broken down by each hazard, wind was the most actively mitigated risk at 55%. Next was floods (44%), temperature extremes (41%), fire (36%), and then earth-related hazards (12%). These are broken out by region in the chart below.   Wind Hazards  Breaking into each hazard, builders/remodelers were further asked which wind mitigation practices they used. The top three were as follows: use a roof system built for high-wind events (46%), continuously sheath exterior from roof to foundation with oriented strand board or plywood (41%), and use high-wind-rated roof coverings installed using practices for high-wind areas (38%). The other four practices are listed in the chart below. Builders and remodelers also mentioned additional practices that they use to address wind hazards including the use of hurricane ties and using hurricane clips for each rafter, additional bracing, and design strategies like designing for a “partially enclosed structure” and detailing airflow through attic spaces.   Flood Hazards  Flood damage is another risk for real estate. The top practice used to mitigate water damage was using a secondary water barrier on the roof at 32% of total respondents. This was followed closely by raising the lowest floor of home more than one-foot above flood levels (31%), and using water-resistant materials for walls that allow for easy repair/replacement or promote drainage behind wall cladding (30%). The other practices are provided in the chart below.   Fire Hazards  Wildfire events present another risk for homes and home builders. The top practice for fire mitigation was using noncombustible or fire-resistant materials for exterior walls at just 18%. The second most used practice was installing a roof with fire-resistant features (17%). Followed by the third, landscaping to create a defensible barrier (15%). The final three were installing multipaned windows with one tempered glass pane (13%), installing vents that resist intrusion of embers and flames (13%), and protecting floors over open foundations with noncombustible cladding and type x gypsum board (10%). A few additional approaches were also volunteered by respondents: fire-resistant insulation, fire-suppression systems, draft stops, fire-retardant spray foam and heavy timber construction.  Earth-Related Hazards  Earth-related hazards include earthquakes, landslides/mudslides, and sinkholes. Earth-related resiliency measures are the most niche as a majority of home residential developments are located away from active fault lines. Hence, it’s unsurprising that only 12% of respondents overall actively address these hazards, but this percentage increases to 40% among respondents in the West. The top practices were: provide strong floor-to-wall connections (11%), provide positive connections of posts to beams above and footings below (10%), and create a continuous load path (10%). The rest all fell below 10%*.  Resiliency Certifications   All home builders and remodelers, regardless of whether they identified hazards that they actively seek to mitigate, were asked if they received any of the seven resiliency certifications: NGBS Green+Resilience, LEED resilience credits, IBHS FORTIFIED, NFPA Firewise Community, US Resiliency Council Earthquake or Wind certification, and Arup REDi™ Rating System. Only 14% responded that the homes they build are resiliency certified. The top resiliency system certifications were NGBS Green+Resilience (7%) and LEED Resilience Credits (5%).  Builders who demonstrate that they can build homes that are better able to withstand environmental hazards could develop a competitive advantage. Because these hazards can cause insurance rates to increase, and insurance in some regions can become unavailable altogether, resiliency practices can be helpful to consider. Resilient and green construction are great ways to help builders and homeowners reduce the risks of such events as costs to recover from natural disasters continue to skyrocket.    *Other earth-related hazard mitigation practices: provide strong wall-to-foundation connections (9%), use hurricane clips to connect roof framing to the walls and/or blocking between trusses or rafters continuous sheathing on cripple walls with hold-downs (9%), anchor bolts and tight nail spacing use exterior braced wall practices for high-wind or high-seismic areas or engineered shear walls (8%), install portal frames at garage door openings using (8%), hold-downs and anchor bolts (7%), screw and glue drywall to reduce cracking (5%)    Discover more from Eye On Housing Subscribe to get the latest posts to your email.

Green Building: Resiliency Practices2024-04-22T10:15:33-05:00

Green Building: Trends, Motivations, and Challenges

2024-04-08T12:17:19-05:00

NAHB and the Dodge Construction Network published research on the prevalence of green building in The Building Sustainably: Green & Resilient Single- Family Homes 2024 SmartMarket Brief.  The research found that the overall share of home builders classifying more than half their projects as green1 is at 34% for 2023 a one-percentage point increase from 2019. Similarly, for remodelers, this figure stands at 22%, a five-percentage point increase from 2019. This post will further examine these statistics, as well as delve into the drivers and obstacles for green building.   Level of Engagement   To further dissect the share of builders and remodelers involved with green projects, see the charts below. As shown, the largest proportion for both builders and remodelers are those with “no green engagement”. However, these numbers have diminished since the 2019 report, decreasing two percentage points for builders and seven percentage points for remodelers. Following those with no green engagement, are those with “little green engagement” (1-50% green projects). For builders, the next highest share is “dedicated green builders” (more than 90% green projects), and then “green builders” (51-90% green projects). The opposite is true for remodelers with the least prevalent share being dedicated green builders.    When looking at dedicated green builders, we see regional differences as well. Based on new home builder respondents, the region with the highest share is the Northeast at 45%. Followed by the West at 28%, the Midwest at 22%, with the South at 16%.   Motivations Respondents who have done green projects were asked to pick the most important reasons for doing so. The top reason at 48% was “The Right Thing to Do”, followed by the closely aligned “Creating Healthier Homes” at 38%. This demonstrates many builders’ intent to create efficient, resilient and environmentally friendly housing, whether it is considered green or not. Other reasons listed include: “Code Requirements” (36%) “Reputation in Industry” (30%), “Differentiate Product in Local Market” (23%), “Market Demand” (18%), and “Tax Credits or Government Incentives” (16%).   Obstacles  Respondents were also asked the top obstacles for them to not undertake green projects. The top answer at 77% was “Lack of Customer Demand”. This is unsurprising with “Market Demand” being listed almost last for reasons to build green. “Too Expensive” was the second reason at 53%. All other reasons fell below 20% of respondents.   Costs Delving into the expense of building green, respondents were asked about the cost premium to build green. Across the board, remodelers found green building to be more expensive.  The highest percent of remodelers (36%) and builders (38%) were those that found green building to be between 11-20% more costly. The next highest for remodelers (28%) were those that found the cost premium to be more than 20%, while the second highest for builders were those the cost premium under 10%. The other categories are shown in the chart below.     Unsurprisingly, builders and remodelers with more green engagement found the cost margin to be lower than those who did fewer green homes. Nearly half (45%) of dedicated green builders found that the added cost of building green is 10% or less. This is in contrast to only 25% of green builders, and 16% of low green engagement builders who listed the added cost as less than 10%. This may suggest that dedication to green building is needed to result in sufficient expertise and economies of scale to lower the cost of building green.   Looking forward, this post will be followed by a series of analyses that further examine the The Building Sustainably: Green & Resilient Single- Family Homes 2024 SmartMarket Brief.    *A green home incorporates strategies in design and construction that improve energy, water and resource efficiency, indoor environmental quality, and minimize environmental impacts on the site; and/or is certified by a third party to the National Green Building Standard, LEED for Homes, or any other green rating system or high-performance standard. 

Green Building: Trends, Motivations, and Challenges2024-04-08T12:17:19-05:00

Coastal Construction: Outsized Multifamily Construction Compared to Single-Family

2024-03-27T07:18:55-05:00

As part of the recently published HBGI, new NAHB analysis of residential permit data shows that about a quarter of single-family construction takes place in coastal counties. Coastal counties, as defined by U.S. Census Bureau, are counties that are adjacent to coastal water or a territorial sea. These coastal counties are grouped into three regions: the Atlantic, Gulf of Mexico, and Pacific. The four-quarter moving average market share (shown below) for single-family construction in coastal counties has marginally changed over the past nine years. The lowest market share occurred in the first quarter of 2021 at 23.09% of the market. After this minimum, the share rose to a peak of 25.01% in the second quarter of 2023. For the multifamily market, construction in coastal areas has been trending downward over the past nine years. The four-quarter moving average peaked during this period in the fourth quarter of 2015 at 43.51%. The share remained relatively level around 35% until 2021 when it began to descend. The current market share for coastal areas in the multifamily construction is 30.32%. While the coastal market share of multifamily construction has been falling recently, it has historically held a larger share compared to single-family coastal construction. Census estimates reveal that the seven densest populated counties (population per square mile) in the U.S. are coastal counties. Higher population density makes it difficult to construct single-family housing due to limited space availability, making multifamily construction the more economical option. Due to the population density of multiple coastal counties, demand for multifamily construction in coastal counties has been continually higher than that of single-family building.Additionally, the annual population share of coastal counties has remained relatively consistent at 28% of the total U.S. population. This share was at 28.72% in 2021 but has fallen very slightly over the past two years to 28.21% in 2023.

Coastal Construction: Outsized Multifamily Construction Compared to Single-Family2024-03-27T07:18:55-05:00

U.S. Financial Accounts Fourth Quarter Wealth Data

2024-03-13T11:18:52-05:00

According to the 2023 fourth quarter release of the Federal Reserve Z.1 Financial Accounts of the United States , the market value of household real estate assets fell from $45.21 trillion to $44.84 trillion in the fourth quarter of 2023. Over the year, household real estate assets were 5.28% higher. Between the third and fourth quarters of 2023, the market value of household real estate assets fell by $365.85 billion, a 0.81% decrease. Total nonfinancial assets held by households and nonprofits fell by $551.886 billion to $57.9 trillion. Real estate owned by households is by far the largest share of households and nonprofit’s nonfinancial assets making up 77% of the market value. Nonprofit’s nonfinancial assets (real estate, equipment, and intellectual property) make up about 9%, while consumer durables make up the remaining 14% of nonfinancial assets in the balance sheet. Total financial assets for households and nonprofits grew by $5.56 trillion over the quarter to end the year at $118.83 trillion. Directly held stock holds the largest share of total financial assets at 27% ($32.00 trillion) Real estate secured liabilities of households’ balance sheets, i.e., mortgages, home equity loans, and HELOCs, increased 0.69% over the fourth quarter to $13.05 trillion,. Year-over-year, real estate liabilities have increased 2.81%. The level of one-to-four-family residential mortgages outstanding to end 2023 stood at $13.99 trillion. Of the parties that held these mortgages as liabilities, households held $13.05 trillion, nonfinancial corporate businesses held $20.7 billion, while nonfinancial noncorporate businesses held the remaining $920.5 billion. Since 2003, the shares of these outstanding liabilities have remained consistent, with households holding above 92%. To end 2023, households held 93.3%, nonfinancial noncorporate businesses held 6.6%, while nonfinancial corporate businesses held 0.01% of the outstanding liabilities of one-to-four-family residential mortgages. Sectors that hold one-to-four-family residential mortgages as assets have seen little change over the past few years. The largest holder of these mortgages as assets continued to be Government Sponsored Entities (GSEs) which held $6.71 trillion or 48.0% of the assets. The second largest holder was Agency- and GSE-back mortgage pools, which held $2.40 trillion or 17.1%. Mortgage pools are a group of mortgages used as collateral for a mortgage-backed security. In the financial accounts, these mortgage pools equal the unpaid balances of the mortgages in the pools. The shift that occurred between the end of 2009 and 2010 between these two groups was due to new accounting rules in the first quarter of 2010 which required Freddie Mac and Fannie Mae (both GSEs) to move almost all their one-to-four-family mortgages on to their consolidated balance sheets. The GSE share of assets jumped from 3.9% in 2009 to 44.6% in 2010.

U.S. Financial Accounts Fourth Quarter Wealth Data2024-03-13T11:18:52-05:00

About My Work

Phasellus non ante ac dui sagittis volutpat. Curabitur a quam nisl. Nam est elit, congue et quam id, laoreet consequat erat. Aenean porta placerat efficitur. Vestibulum et dictum massa, ac finibus turpis.

Recent Works

Recent Posts