Aging-in-Place Remodeling Work Fell While Familiarity and Receptiveness Remain High
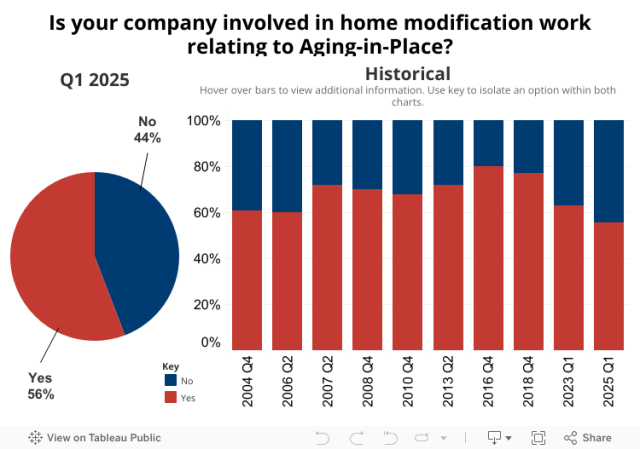
Eric Lynch2025-05-28T08:21:36-05:00Only 56% of professional remodelers undertake projects designed to allow homeowners to Age-in-Place (AIP), according to results from NAHB’s Q1 2025 Remodeling Market Index (RMI) survey. This is the lowest percentage recorded since NAHB began periodically asking AIP questions on its RMI survey in 2004. Economic uncertainty and high interest rates over the past year are the most likely explanations for this slight pullback in projects. Additionally, stock market volatility has dampened any potential wealth effects, especially since over 75% of all corporate equities and mutual fund holdings are held by those 55 or older. The National Institute of Aging defines AIP as “staying in your own home as you get older.” This concept is becoming more relevant as the overall median age of the population continues to increase. Given the age of the existing housing stock, the need to update homes for AIP is a major demand-driver for the remodeling sector. Age Groups When asked about the age groups of homeowners who request AIP work, 73% of remodelers indicated that homeowners are 65 years or older, followed by 55 to 64 years at 61%. These two age groups have consistently been above 60% since the Q4 2010 survey. Familiarity with Aging-in-Place Ninety-six percent of remodelers indicated that most or some of their consumers are familiar with the AIP concept. That share has been at least 90% since the Q4 2018 survey. Type of Aging-in-Place Projects Grab bars remain the most common AIP project, with 87% of remodelers reporting this job in the last year, followed by curb-less shower (78%), installing higher toilets (71%), and widening doorways (52%). While their relative ranking has changed, these four have consistently been the AIP project types most often cited by remodelers. Frequency of Aging-in-Place Requests Seventy-three percent of remodelers indicated that requests for AIP features have significantly or somewhat increased over the past 5 years. This figure has not changed much since the inception of the series in 2004, ranging from 72% to 77%. Reasons for Aging-in-Place Work As for the reason why customers are undertaking AIP projects, 91% of remodelers stated that customers are planning ahead for future needs, followed by living with older parents (48%) and acute age-related disabilities (43%). Who is Requesting Aging-in-Place Work? Sixty-five percent of remodelers indicated that a majority of their AIP work was determined by the client, whereas the other 35% said it was mostly suggested by the contractor. The ‘determined by client’ option has consistently been above 50 percent. Receptive to Aging-in-Place Modifications When asked how receptive potential clients are to incorporating suggested AIP modifications, 48% indicated that their customers were very receptive and 51% were somewhat receptive, with only 2% stated that customers were not at all receptive to these modifications. The combined share of potential clients being receptive (‘very receptive’ + ‘somewhat receptive’) has consistently been above 95%. Discover more from Eye On Housing Subscribe to get the latest posts sent to your email.