Mortgage Rates Continued to Decline in August

2024-09-06T08:19:48-05:00

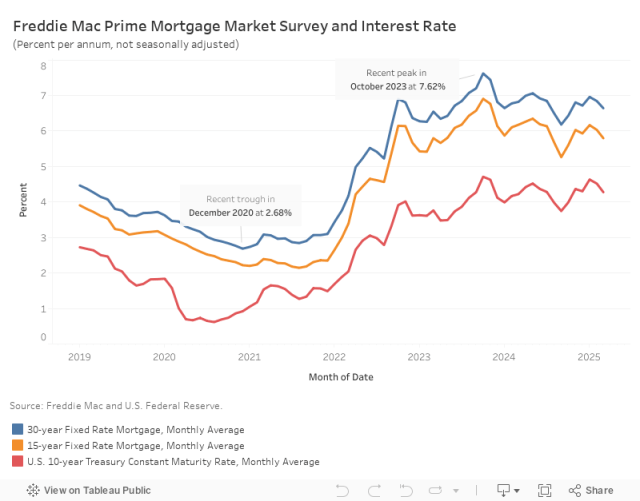
Mortgage rates continued to decrease in August, landing at an average rate of 6.50%. According to Freddie Mac, the average monthly rate fell by 35 basis points (bps) from July’s rate of 6.85%. The August rate is down 57 bps from one year ago, which stood at 7.07%. The 15-year fixed-rate mortgage also saw a decrease, dropping by 45 bps from July to 5.68%, and is now lower compared to last August by 75 bps. Additionally, the 10-year Treasury rate declined 30 bps from 4.28% in July to 3.98%. Per the NAHB forecast, we expect 30-year mortgage rates to decline slightly to around 6.66% at the end of 2024 and eventually to decline to just under 6% by the end of 2025. The NAHB outlook anticipates the federal funds rate to be cut by 25 bps no later than the December Federal Reserve meeting, although it is possible for the Fed to cut rates in the upcoming FOMC meeting in September. Discover more from Eye On Housing Subscribe to get the latest posts sent to your email.

Mortgage Rates Continued to Decline in August2024-09-06T08:19:48-05:00

Refinancing Activity Jumped in August as Mortgage Rates Declined

2024-09-05T13:15:16-05:00

The Market Composite Index, a measure of mortgage loan application volume by the Mortgage Bankers Association’s (MBA) weekly survey, saw a month-over-month increase of 10.7% on a seasonally adjusted (SA) basis. Compared to last August, the index increased by 20.8%. While the Purchase Index declined by 2.9%, month-over-month, the Refinance Index jumped 30.8% as borrowers took advantage of the declining mortgage rates to refinance higher-rate loans. On a yearly basis, the Purchase Index is down by 8.6%, while the Refinance Index increased by 87.2%. The average monthly 30-year fixed mortgage rate has fallen for four straight months with August seeing the largest decrease of 40 basis points (bps), bringing the rate to 6.49%. The current rate is 73 bps lower than last August. The average loan size for the total market (including purchases and refinances) is up 3.6% from July to $380,800 on a non-seasonally adjusted (NSA) basis. Similarly, the month-over-month change for purchase loans increased 0.6% to an average size of $426,600, while refinance loans rose by 18.5% to an average of $325,800. The average loan size for an adjustable-rate mortgage (ARM) also saw a steep increase of 9.5% for the same period, from $1.01 million to $1.1 million. Discover more from Eye On Housing Subscribe to get the latest posts sent to your email.
Refinancing Activity Jumped in August as Mortgage Rates Declined2024-09-05T13:15:16-05:00

Small Decrease in Mortgage Activity for July

2024-08-07T09:19:14-05:00

The Market Composite Index, a measure of mortgage loan application volume by the Mortgage Bankers Association’s (MBA) weekly survey, saw a slight month-over-month decline of 0.8% on a seasonally adjusted (SA) basis; compared to July 2023, the index increased by 0.5%. The Purchase Index declined by 4.8%, while the Refinance Index increased by 5.8%, month-over-month. On a yearly basis, the Purchase Index decreased by 13.9%, while the Refinance Index increased by 33.9%. Meanwhile, the average monthly 30-year fixed mortgage rate continued to decline for three straight months with July seeing the largest decrease of 10 basis points (bps) to land an at 6.88% in July. The current rate is also lower than last July by 6 bps. The average loan size for the total market (including purchases and refinances) is down by 1.5% from June to $367,900 on a non-seasonally adjusted (NSA) basis in July. Similarly, the month-over-month change for purchase loans decreased 1.6% to an average size of $424,200, while refinance loans increased by 2.5% to an average of $275,325. The average loan size for an adjustable-rate mortgage (ARM) decreased by 2.5% for the same period, from $1.03 million to $1.01 million. Discover more from Eye On Housing Subscribe to get the latest posts sent to your email.

Small Decrease in Mortgage Activity for July2024-08-07T09:19:14-05:00

Mortgage Rates Continued to Decline in July

2024-08-02T09:16:12-05:00

Mortgage rates continued to decrease in July, landing at an average rate of 6.85%. According to Freddie Mac, the average monthly rate fell by 7 basis points (bps) from June’s rate of 6.92%. This current rate is nearly identical to the rate from one year ago, which stood at 6.84%. The 15-year fixed-rate mortgage also saw a decrease, dropping by 5 bps from June to 6.14%, and is now lower compared to last July by 4 bps. Additionally, the 10-year Treasury rate declined 9 bps from 4.37% in June to 4.28%. Per the NAHB forecast, we expect 30-year mortgage rates to decline slightly to around 6.66% at the end of 2024 and eventually to decline to just under 6% by the end of 2025. The NAHB outlook anticipates the federal funds rate to be cut by 25 bps no later than the December Federal Reserve meeting and six more rate cuts in 2025 as inflation approaches the Fed’s policy target. Discover more from Eye On Housing Subscribe to get the latest posts sent to your email.

Mortgage Rates Continued to Decline in July2024-08-02T09:16:12-05:00

Increase in Mortgage Activity for June

2024-07-09T08:25:26-05:00

The Market Composite Index, a measure of mortgage loan application volume by the Mortgage Bankers Association’s (MBA) weekly survey, increased by 8.2% on a seasonally adjusted (SA) basis from May to June. In comparison to June 2023, the index isup by 1.0%. The Purchase and Refinance indices, over the month, are up by 4.1% and 14.3% (SA), respectively. On a yearly basis, the Purchase Index decreased by 10.8%; the Refinance Index, on the other hand, increased by 29.4%. The increase in mortgage activities brought about by a 9.8 basis points (bps) decline in the 30-year fixed mortgage rate, from an average rate of 7.08% in May to an average of 6.98% in June. However, compared to the same month last year, the mortgage rate for June is higher by 19.8 bps. The average loan size for the total market (including purchases and refinances) is down by2.0% from May to $373,500 on a non-seasonally adjusted (NSA) basis in June. Similarly, the month-over-month change for purchase loans decreased 1.7% to an average size of $431,000 (NSA), while refinance loans increased by 4% to an average of $268,500 (NSA). The average loan size for an adjustable-rate mortgage (ARM) increased by 2.9% for the same period, from $1 million to $1.03 million. Discover more from Eye On Housing Subscribe to get the latest posts to your email.

Increase in Mortgage Activity for June2024-07-09T08:25:26-05:00

Mortgage Rates Declined in June but Remain High

2024-06-28T11:15:07-05:00

According to Freddie Mac, the average 30-year fixed-rate mortgage decreased by 14 basis points (bps) from 7.06% in the previous month to 6.92% in June 2024. This decline comes after increases from 6.64% in January to a peak above 7.2% in May. Nonetheless, the current rate is still higher from one year ago by 21 bps, sidelining potential home buyers who are waiting for mortgage rates to decrease. Similarly, the 15-year fixed-rate mortgage also decreased by 16 bps from last month to 6.19% but remains 10 bps higher compared to last year. Mortgage rates declined as inflation data moderated and the 10-year Treasury rate fell back 15 bps from 4.52% in May to 4.37% in June. Per the NAHB forecast, we expect 30-year mortgage rates to decline slightly to around 6.66% at the end of 2024 and eventually to decline to just under 6% by the end of 2025. The NAHB outlook anticipates the federal funds rate to be cut by 25 bps at the December Federal Reserve meeting and six more rate cuts in 2025 as inflation approaches the Fed’s target. Discover more from Eye On Housing Subscribe to get the latest posts to your email.

Mortgage Rates Declined in June but Remain High2024-06-28T11:15:07-05:00

Existing Home Sales Slid Amid Record High Prices

2024-06-21T10:17:08-05:00

Existing home sales fell for the third straight month in May due to lingering high mortgage rates and record-high prices, according to the National Association of Realtors (NAR). Low resale inventory and strong demand continued to drive up existing home prices, marking the eleventh consecutive month of year-over-year median sales price gains.  However, rising inventory is likely to dampen home price growth in the months ahead. Homeowners with lower mortgage rates have opted to stay put, avoiding trading in for higher rates. This trend is driving home prices higher and resale inventory lower. Eventually, mortgage rates are expected to decrease gradually, leading to increased demand (and unlocking lock-in inventory) in the coming quarters. However, that decline is dependent on future inflation reports. Total existing home sales, including single-family homes, townhomes, condominiums, and co-ops, fell 0.7% to a seasonally adjusted annual rate of 4.11 million in May (as shown below). On a year-over-year basis, sales were 2.8% lower than a year ago. The first-time buyer share fell to 31% in May, down from 33% in April but up from 28% in May 2023. The inventory level rose from 1.20 million in April to 1.28 million units in May and is up 18.5% from a year ago. At the current sales rate, May unsold inventory sits at a 3.7-months supply, up from 3.5-months last month and 3.1-months a year ago. This inventory level remains very low compared to balanced market conditions (4.5 to 6 months’ supply) and illustrates the long-run need for more home construction. However, the count of single-family resale homes available for sale is up almost 18% on a year-over-year basis, with a 7.7% gain in May. Homes stayed on the market for an average of 24 days in May, down from 26 days in April but up from 18 days in May 2023. The May all-cash sales share was 28% of transactions, unchanged from April but up from 25% a year ago. All-cash buyers are less affected by changes in interest rates. The May median sales price of all existing homes was $419,300, up 5.8% from last year. This marked the highest recorded price. The median condominium/co-op price in May was up 5.1% from a year ago at $353,300. This rate of price growth will slow as inventory increases. Existing home sales in May were mixed across the four major regions (as shown below). Sales in the Northeast, Midwest, and West remained unchanged in May, while sales in the South fell 1.6%. On a year-over-year basis, three of the four regions saw a decline in sales, ranging from -1.3% in the West to -5.1% in the South. Sales in the Midwest were up 1.0% from a year ago. The Pending Home Sales Index (PHSI) is a forward-looking indicator based on signed contracts. The PHSI fell from 78.3 to 72.3 in April. On a year-over-year basis, pending sales were 7.4% lower than a year ago per the NAR data. Discover more from Eye On Housing Subscribe to get the latest posts to your email.

Existing Home Sales Slid Amid Record High Prices2024-06-21T10:17:08-05:00

About My Work

Phasellus non ante ac dui sagittis volutpat. Curabitur a quam nisl. Nam est elit, congue et quam id, laoreet consequat erat. Aenean porta placerat efficitur. Vestibulum et dictum massa, ac finibus turpis.

Recent Works

Recent Posts