Existing Home Sales Increase in November

2024-12-19T11:19:21-06:00

Despite higher mortgage rates and elevated home prices, existing home sales jumped to an 8-month high in November, marking the second month of annual increase in more than three years, according to the National Association of Realtors (NAR). While inventory improves and the Fed continues lowering rates, the market faces headwinds as mortgage rates are expected to stay above 6% for longer due to an anticipated slower easing pace in 2025. The prolonged rates may continue to discourage homeowners from trading existing mortgages for new ones with higher rates, keeping supply tight and prices elevated. However, as mortgage rates continue trending lower, the gradual improvement in inventory should help slow home price growth and enhance affordability. As such, the recent gains for existing home sales may give way in the coming months of data. Total existing home sales, including single-family homes, townhomes, condominiums, and co-ops, rose 4.8% to a seasonally adjusted annual rate of 4.15 million in November, the highest level since March 2024. On a year-over-year basis, sales were 6.1% higher than a year ago, the largest annual gain since June 2021. The first-time buyer share rose to 30% in November, up from 27% in October but down from 31% in November 2023. The existing home inventory level fell from 1.37 million in October to 1.33 million units in November but is up 17.7% from a year ago. At the current sales rate, November unsold inventory sits at a 3.8-months supply, down from 4.2-months last month but up 3.5-months a year ago. This inventory level remains low compared to balanced market conditions (4.5 to 6 months’ supply) and illustrates the long-run need for more home construction. Homes stayed on the market for an average of 32 days in November, up from 29 days in October and 25 days in November 2023. The November all-cash sales share was 25% of transactions, down from 27% experienced in both October 2024 and November 2023. All-cash buyers are less affected by changes in interest rates. The November median sales price of all existing homes was $406,100, up 4.7% from last year. This marked the 17th consecutive month of year-over-year increases. The median condominium/co-op price in November was up 2.8% from a year ago at $359,800. This rate of price growth will slow as inventory increases. Geographically, three of four regions saw an increase in existing home sales in November, ranging from 5.3% in the Midwest to 8.5% in the Northeast. Sales in the West stayed unchanged in November. On a year-over-year basis, sales grew in all four regions, ranging from 3.3% in the South to 14.9% in the West. The Pending Home Sales Index (PHSI) is a forward-looking indicator based on signed contracts. The PHSI rose from 75.9 to 77.4 in October due to improved inventory. On a year-over-year basis, pending sales were 5.4% higher than a year ago per National Association of Realtors data. Discover more from Eye On Housing Subscribe to get the latest posts sent to your email.

Existing Home Sales Increase in November2024-12-19T11:19:21-06:00

Existing Home Sales Rebound in October

2024-11-21T11:15:05-06:00

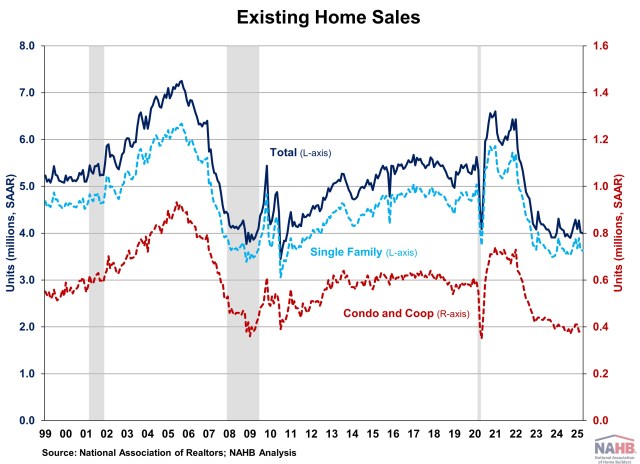
Existing home sales in October rebounded from a 14-year low and posted the first annual increase in more than three years, as buyers took advantage when mortgage rates briefly reached a 2-year low in late September, according to the National Association of Realtors (NAR). While elevated home prices persist due to the lock-in effect, we expect sales activity to increase as mortgage rates moderate with additional Fed easing. Improving inventory should help slow home price growth and enhance affordability. Homeowners with lower mortgage rates have opted to stay put, avoiding trading existing mortgages for new ones with higher rates. This trend is driving home prices higher and holding back inventory. With the Federal Reserve beginning its easing cycle at the September meeting, mortgage rates are expected to gradually decrease, leading to increased demand and unlocking lock-in inventory in the coming quarters. Total existing home sales, including single-family homes, townhomes, condominiums, and co-ops, rose 3.4% to a seasonally adjusted annual rate of 3.96 million in October. On a year-over-year basis, sales were 2.9% higher than a year ago, ending a 38-month streak of year-over-year declines since July 2021. The first-time buyer share rose to 27% in October, up from 26% in September but down from 28% in October 2023. The existing home inventory level rose from 1.36 million in September to 1.37 million units in October and is up 19.1% from a year ago. At the current sales rate, September unsold inventory sits at a 4.2-months supply, down from 4.3-months last month but up 3.6-months a year ago. This inventory level remains low compared to balanced market conditions (4.5 to 6 months’ supply) and illustrates the long-run need for more home construction. Homes stayed on the market for an average of 29 days in October, up from 28 days in September and 23 days in October 2023. The October all-cash sales share was 27% of transactions, down from 30% in September and 29% a year ago. All-cash buyers are less affected by changes in interest rates. The October median sales price of all existing homes was $407,200, up 4.0% from last year. This marked the 16th consecutive month of year-over-year increases. The median condominium/co-op price in October was up 1.6% from a year ago at $360,300. This rate of price growth will slow as inventory increases. Geographically, all four regions saw an increase in existing home sales in October, ranging from 1.3% in the West to 6.7% in the Midwest. On a year-over-year basis, sales rose 1.1%, 2.3%, and 8.5% in the Midwest, South and West. Sales in the Northeast stayed unchanged. The Pending Home Sales Index (PHSI) is a forward-looking indicator based on signed contracts. The PHSI rose from 70.6 to 75.8 in September due to improved inventory and lower mortgage rates in late summer. On a year-over-year basis, pending sales were 2.6% higher than a year ago per National Association of Realtors data. Discover more from Eye On Housing Subscribe to get the latest posts sent to your email.
Existing Home Sales Rebound in October2024-11-21T11:15:05-06:00

Existing Home Sales Fall to 14-Year Low in September

2024-10-23T11:22:12-05:00

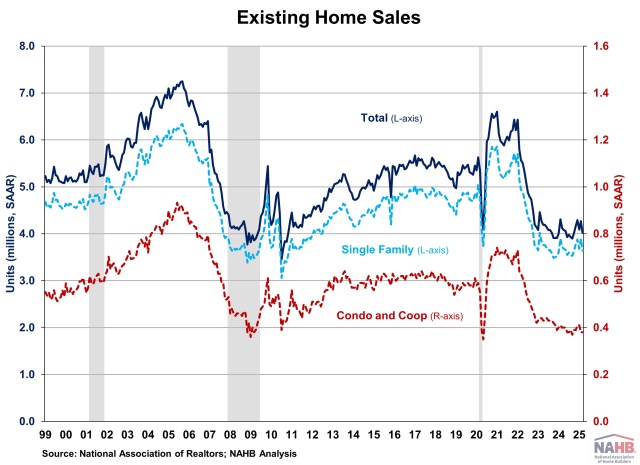
Despite recent easing mortgage rates and improved inventory, existing home sales fell to a 14-year low in September as elevated home prices are causing potential buyers to hold out for lower rates, according to the National Association of Realtors (NAR). Sales remained sluggish as the lock-in effect kept home prices elevated. However, we expect increased activity in the coming months as mortgage rates moderate with additional Fed easing. Improving inventory should help slow home price growth and enhance affordability. Homeowners with lower mortgage rates have opted to stay put, avoiding trading existing mortgages for new ones with higher rates. This trend is driving home prices higher and holding back inventory. With the Federal Reserve beginning its easing cycle at the September meeting, mortgage rates are expected to gradually decrease, leading to increased demand and unlocking lock-in inventory in the coming quarters. Total existing home sales, including single-family homes, townhomes, condominiums, and co-ops, fell 1.0% to a seasonally adjusted annual rate of 3.84 million in September, the lowest level since October 2010. On a year-over-year basis, sales were 3.5% lower than a year ago. The first-time buyer share remained at 26% in September, matching the lowest level since November 2021 and August 2024, but down from 27% in September 2023. The existing home inventory level rose from 1.37 million in August to 1.39 million units in September and is up 23.0% from a year ago. At the current sales rate, September unsold inventory sits at a 4.3-months supply, up from 4.2-months last month and 3.4-months a year ago. This inventory level remains low compared to balanced market conditions (4.5 to 6 months’ supply) and illustrates the long-run need for more home construction. However, the count of single-family resale homes available for sale is up almost 22.2% on a year-over-year basis. Homes stayed on the market for an average of 28 days in September, up from 26 days in August and 21 days in September 2023. The September all-cash sales share was 30% of transactions, up from 26% in August and 29% a year ago. All-cash buyers are less affected by changes in interest rates. The September median sales price of all existing homes was $404,500, up 3.0% from last year. This marked the 15th consecutive month of year-over-year increases and the highest level for the month of September. The median condominium/co-op price in September was up 2.2% from a year ago at $361,600. This rate of price growth will slow as inventory increases. Existing home sales in September were mixed across the four major regions. In the Northeast, Midwest, and South, sales fell by 4.2%, 2.2%, and 1.7%, respectively, while sales in the Midwest rose by 4.1%. On a year-over-year basis, sales decreased in the Northeast (-6.1%), Midwest (-5.3%) and South (-5.5%). Sales in the West increased 5.6% from a year ago. The Pending Home Sales Index (PHSI) is a forward-looking indicator based on signed contracts. The PHSI rose from 70.2 to 70.6 in August due to lower mortgage rates. On a year-over-year basis, pending sales were 3.0% lower than a year ago per National Association of Realtors data. Discover more from Eye On Housing Subscribe to get the latest posts sent to your email.
Existing Home Sales Fall to 14-Year Low in September2024-10-23T11:22:12-05:00

About My Work

Phasellus non ante ac dui sagittis volutpat. Curabitur a quam nisl. Nam est elit, congue et quam id, laoreet consequat erat. Aenean porta placerat efficitur. Vestibulum et dictum massa, ac finibus turpis.

Recent Works

Recent Posts