Inflation Accelerates for Second Straight Month

2023-09-13T13:17:49-05:00

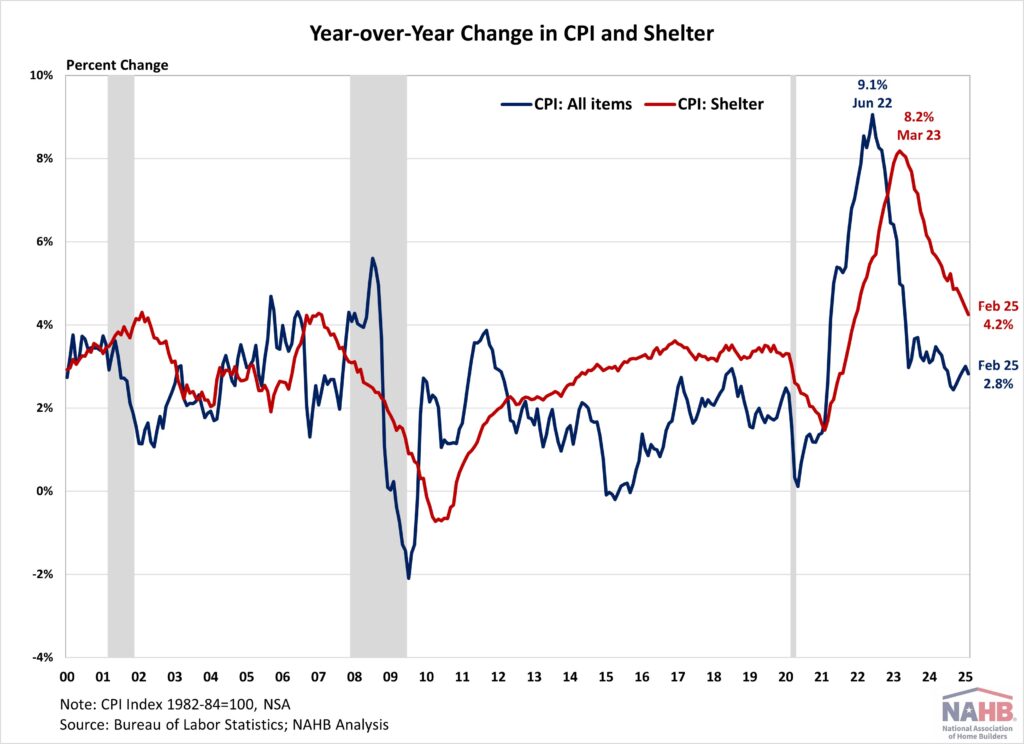
Consumer prices in August saw the largest monthly gain since June 2022, primarily driven by a surge in gasoline costs. Core service inflation excluding housing was little changed in August, suggesting that the path toward disinflation ahead still has some fluctuations. Meanwhile, shelter costs continued to remain at a high level and was the second-largest contributor to the increase in inflation. The Fed’s ability to address rising housing costs is limited as shelter cost increases are driven by a lack of affordable supply and increasing development costs. Additional housing supply is the primary solution to tame housing inflation. The Fed’s tools for promoting housing supply are at best limited. In fact, further tightening of monetary policy will hurt housing supply by increasing the cost of AD&C financing. This can be seen on the graph below, as shelter costs continue to rise despite Fed policy tightening. Nonetheless, the NAHB forecast expects to see shelter costs decline further later in 2023, supported by real-time data from private data providers that indicate a cooling in rent growth. The Bureau of Labor Statistics (BLS) reported that the Consumer Price Index (CPI) rose by 0.6% in August on a seasonally adjusted basis, following an increase of 0.2% in July. The price index for a broad set of energy sources rose by 5.6% in August as all the major energy component indexes increased.  Excluding the volatile food and energy components, the “core” CPI rose by 0.3% in August, following an increase of 0.2% in July. Meanwhile, the food index increased by 0.2% in August with the food at home index rising 0.2%. In August, the indexes for gasoline (+10.6%) and shelter (+0.3%) were the largest contributors to the increase in the headline CPI. Meanwhile, the indexes for lodging away from home (-3.0%), used car and trucks (-1.2%) as well as recreation (-0.2%) declined in August. The index for shelter, which makes up more than 40% of the “core” CPI, rose by 0.3% in August, following an increase of 0.4% in July. The indexes for owners’ equivalent rent (OER) increased by 0.4% and rent of primary residence (RPR) increased by 0.5% over the month. Monthly increases in OER have averaged 0.5% over the last eight months. These gains have been the largest contributors to headline inflation in recent months. During the past twelve months, on a not seasonally adjusted basis, the CPI rose by 3.7% in August, following a 3.2% increase in July. The “core” CPI increased by 4.3% over the past twelve months, following a 4.7% increase in July. This was the slowest annual gain since October 2021. The food index rose by 4.3% while the energy index fell by 3.6% over the past twelve months. NAHB constructs a “real” rent index to indicate whether inflation in rents is faster or slower than overall inflation. It provides insight into the supply and demand conditions for rental housing. When inflation in rents is rising faster (slower) than overall inflation, the real rent index rises (declines). The real rent index is calculated by dividing the price index for rent by the core CPI (to exclude the volatile food and energy components). The Real Rent Index rose by 0.2% in August. Related ‹ Mortgage Activity Low as Rates Remain Above Seven PercentTags: cpi, fed, inflation, shelter

Inflation Accelerates for Second Straight Month2023-09-13T13:17:49-05:00

Price Growth of Key Building Materials Moderates Further

2023-08-11T14:35:30-05:00

According to the latest Producer Price Index report, the price level of inputs to residential construction less energy (i.e., building materials) edged up 0.2% in July (not seasonally adjusted).  Building materials price growth has slowed considerably in 2023 with an average monthly increase of 0.2%–down from 0.7% in 2022 and 1.5% in 2021. Not since prior to the COVID-19 pandemic has the average been lower (0.0% in 2019). The Producer Price Index for all final demand goods rose 0.1% in July, up from an unchanged reading in June (seasonally adjusted). Year-over-year, the index declined 2.5% while the PPI for final demand goods less food and energy increased 1.9% (not seasonally adjusted) with the disparity driven by a 16.8% decrease in energy prices. The PPI for goods inputs to residential construction, including energy, has decreased 2.2% over the past 12 months. March 2023 was the last month in which the index increased. Gypsum Building Materials The PPI for gypsum building materials fell 0.1% in July—the fourth consecutive monthly decline. Over the first seven months of 2023, year-over-year price increases have slowed from 11.1% to 2.6%. The average 12-month increase this year has been 8.5% compared to 20.0% in 2022. Steel Mill Products The price of steel mill products (i.e., the raw materials used to make intermediate and finished steel goods) fell 7.6% in July after decreasing 0.6% the month prior (NSA).  Since climbing 12.4% between January and May, prices have declined 8.0%. The index is 21.0% lower than it stood one year ago and has decreased 29.0% since reaching its all-time high in December 2021. Softwood Lumber The PPI for softwood lumber (seasonally adjusted) increased 8.6% in July—the third and largest increase over the past four months during which the index has climbed 16.4%. In contrast, the Random Lengths Framing Lumber Composite Price increased roughly 5% in July. This difference results primarily from the seasonal adjustment of data. The unadjusted softwood lumber PPI increased 4.4% in July, in line with the Random Lengths data.  These differences can be quite substantial. Other causes of the difference include the timing of the PPI survey as well as the composition and weighting of the softwood lumber index. Ready-Mix Concrete Ready-mix concrete (RMC) prices increased 0.1% in July after a commensurate percentage decline in June. Like gypsum building materials prices, monthly price increases of concrete have slowed substantially in 2023. The PPI for RMC has increased 0.6% per month this year, on average, the lowest average since 2020. Prices have increased 3.3%, year-to-date, roughly half the YTD increase in July 2022. Prices increased 1.3% and 0.9% in the Midwest and South, respectively (not seasonally adjusted), were unchanged in the Northeast, and fell 0.2% in the West region. Year-to-date, prices have increased 9.1% in the Northeast, more than triple the average YTD increases seen in the other three regions. Services The price index of services inputs (excluding labor) to residential construction increased 1.5% in July following a flat reading in June. The increase was primarily driven by a 5.6% increase in the index for building materials retailers’ gross margins which accounts for nearly one-third of the services inputs PPI. Freight Prices Producer prices for the transportation of freight continued their downward trend in July. The price rail and truck transportation of freight declined 0.1% and 0.2%, respectively, while the PPI for ocean transportation of freight was unchanged. Additionally, the index for arrangement of freight and cargo (i.e., shipping logistics services) fell 2.2% over the month. Prices have decreased 30.2% over the past 12 months as both international as well as domestic supply chain bottlenecks have eased. Related ‹ Rising Mortgage Rates and Home Prices Put a Damper on Housing AffordabilityTags: Building Materials, building materials prices, construction costs, drywall, freight prices, Gypsum, inflation, inputs to residential construction, lumber, ppi, producer price index, producer prices, residential construction, softwood lumber, steel, supply chains

Price Growth of Key Building Materials Moderates Further2023-08-11T14:35:30-05:00

Housing Costs Persist as Key Driver of Inflation

2023-08-10T09:15:26-05:00

Consumer prices showed a slight uptick in July, with core inflation remained sticky, ending a streak of 12 consecutive months of steady declines. Despite a slowdown compared to the previous month, the shelter index (housing inflation) continued to be the largest contributor to both headline and core inflation, accounting for over 90% of the increase in headline inflation. The Fed’s ability to address rising housing costs is limited as shelter cost increases are driven by a lack of affordable supply and increasing development costs. Additional housing supply is the primary solution to tame housing inflation. The Fed’s tools for promoting housing supply are at best limited. In fact, further tightening of monetary policy will hurt housing supply by increasing the cost of AD&C financing. This can be seen on the graph below, as shelter costs continue to rise despite Fed policy tightening. Nonetheless, the NAHB forecast expects to see shelter costs decline further later in 2023, supported by real-time data from private data providers that indicate a cooling in rent growth. The Bureau of Labor Statistics (BLS) reported that the Consumer Price Index (CPI) rose by 0.2% in July on a seasonally adjusted basis, the same increase as in June. The price index for a broad set of energy sources rose by 0.1% in July as the increase in gasoline index (+0.2%), natural gas index (+2.0%) and fuel oil index (+3.0%) more than offset the declines in electricity index (-0.7%).  Excluding the volatile food and energy components, the “core” CPI rose by 0.2% in July, the same increase as in June. Meanwhile, the food index increased by 0.2% in July with the food at home index rising 0.3%. In July, the indexes for shelter (+0.4%) and motor vehicle insurance (2.0%) were the largest contributors to the increase in the headline CPI. Meanwhile, the indexes for airline fares (-8.1%), used car and trucks (-1.3%) as well as communication (-0.1%) declined in July. The index for shelter, which makes up more than 40% of the “core” CPI, rose by 0.4% in July, same increase in June. The indexes for owners’ equivalent rent (OER) increased by 0.5% and rent of primary residence (RPR) increased by 0.4% over the month. Monthly increases in OER have averaged 0.6% over the last seven months. These gains have been the largest contributors to headline inflation in recent months. During the past twelve months, on a not seasonally adjusted basis, the CPI rose by 3.2% in July, following a 3.0% increase in June. The “core” CPI increased by 4.7% over the past twelve months, following a 4.8% increase in June. This was the slowest annual gain since October 2021. The food index rose by 4.9% while the energy index fell by 12.5% over the past twelve months. NAHB constructs a “real” rent index to indicate whether inflation in rents is faster or slower than overall inflation. It provides insight into the supply and demand conditions for rental housing. When inflation in rents is rising faster (slower) than overall inflation, the real rent index rises (declines). The real rent index is calculated by dividing the price index for rent by the core CPI (to exclude the volatile food and energy components). The Real Rent Index rose by 0.3% in July. Related ‹ Mortgage Activity Decreases for Third Straight WeekRising Mortgage Rates and Home Prices Put a Damper on Housing Affordability ›Tags: cpi, inflation, shelter

Housing Costs Persist as Key Driver of Inflation2023-08-10T09:15:26-05:00

Consumer Debt Growth Slows as Inflation Cools and Lending Standards Tighten

2023-08-08T15:19:45-05:00

Consumer credit outstanding growth slowed to 4.0% in the second quarter 2023 (SAAR) according to the Federal Reserve’s latest G.19 Consumer Credit report, as revolving and nonrevolving debt grew at 7.1% and 3.0%, respectively. Revolving credit growth has decelerated as of late, a result of both cooling inflation and increasingly tight lending standards. Total consumer credit outstanding stands at $5.0 trillion (break-adjusted[1] and seasonally adjusted), with $1.3 trillion in revolving debt and $3.7 trillion in non-revolving debt. Seasonally adjusted revolving and nonrevolving debt accounted for 25.3% and 74.7% of total consumer debt, respectively.  Revolving consumer credit outstanding as a share of the total decreased 0.1 percentage point over the quarter but increased 0.4 percentage point over the past year. Auto and Student Loan Debt With every quarterly G.19 report, the Federal Reserve releases a memo item covering student and motor vehicle loans’ outstanding. The most recent release shows that the balance of student loans was $1.77 trillion (not seasonally adjusted) at the end of the second quarter while the amount of auto loan debt outstanding stood at $1.53 trillion (NSA). Auto loan interest rates continued to climb as the rate for a 60-month new car loan increased to 7.81% in Q2—the highest reading since 2006. The rate has surged 3.29 ppts—more than 70%–since the Federal Reserve began the current rate hike cycle in the first quarter of 2022. Together, student and auto loans made up 88.2% of nonrevolving credit balances (NSA)—the smallest share since 2010 and 0.5 ppt lower than the share in Q2 2022. [1] The results of the 2020 Census and Survey of Finance Companies–delayed by the pandemic–were incorporated in the latest Consumer Credit (G.19) statistical release, resulting in large revisions dating back to June 2021. Rather than retain the large spike in credit that now appears in the raw data, we have used the “break-adjusted” historical time series developed by Moody’s Analytics and will continue to do so moving forward. Click here for more information. Related ‹ Dramatic Apartment Construction Time Lengthening in 2022Tags: auto loans, borrowing costs, consumer credit, consumer debt, Federal Reserve, g.19, household balance sheets, household credit, household debt, inflation, interest rates, lending conditions, lending standards, nonrevolving debt, revolving debt

Consumer Debt Growth Slows as Inflation Cools and Lending Standards Tighten2023-08-08T15:19:45-05:00

GDP Growth Is Stronger Than Expected in the Second Quarter

2023-07-27T10:28:00-05:00

The U.S. economy grew at a solid pace in the second quarter of 2023, fueled by consumer and government spending. The second quarter data from the GDP report suggests that inflation is cooling. The GDP price index rose 2.2% for the second quarter, down from a 4.1% increase in the first quarter. It marks the slowest annual growth rate since the third quarter of 2020. The Personal Consumption Expenditures (PCE) price Index, capturing inflation (or deflation) across a wide range of consumer expenses and reflecting changes in consumer behavior, rose 2.6% in the second quarter, down from a 4.1% increase in the first quarter. According to the “advance” estimate  released by the Bureau of Economic Analysis (BEA), real gross domestic product (GDP) increased at an annual rate of 2.4% in the second quarter of 2023, following a 2% gain in the first quarter. This quarter’s growth was above NAHB’s forecast of a 1.4% increase. This quarter’s increase reflected increases in consumer spending, nonresidential fixed investment, government spending, and private inventory investment, partially offset by decreases in exports and residential fixed investment. Imports, which are a subtraction in the calculation of GDP, decreased. Consumer spending rose at an annual rate of 1.6% in the second quarter, reflecting increases in both services and goods. While expenditures on services increased 2.1% at an annual rate, goods spending increased 0.7% at an annual rate, led by gasoline and other energy goods (+13.1%). Meanwhile, federal government spending increased 0.9% in the second quarter, while state and local government spending rose 3.6%, reflecting increases in compensation of state and local government employees and gross investment in structures. Nonresidential fixed investment increased 7.7% in the second quarter, up from a 0.6% increase in the first quarter. The quarter’s increase in nonresidential fixed investment reflected increases in equipment (+10.8%), structures (+9.7%), and intellectual property products (+3.9%). Additionally, residential fixed investment (RFI) decreased 4.2% in the second quarter. This was the ninth consecutive quarter for which RFI subtracted from the headline growth rate for overall GDP. Within residential fixed investment, single-family structures rose 0.8% at an annual rate, multifamily structures rose 1.5% and other structures (specifically brokers’ commissions) decreased 8.9%. Related ‹ More New Homes Improve Expectations of Housing AvailabilityTags: economics, gdp, inflation, macroeconomics, macroeconomy, residential fixed investment

GDP Growth Is Stronger Than Expected in the Second Quarter2023-07-27T10:28:00-05:00

CPI Eases Further as Housing Inflation Slows

2023-07-12T09:16:44-05:00

Consumer prices in June saw a continued deceleration, with the smallest year-over-year gain since March 2021. Over the past twelve months, inflation has been consistently decelerating. Despite a slowdown compared to the previous month, the shelter index (housing inflation) continued to be the largest contributor to both headline and core inflation, accounting for over 70% of the increase in headline inflation. The Fed’s ability to address rising housing costs is limited as shelter cost increases are driven by a lack of affordable supply and increasing development costs. Additional housing supply is the primary solution to tame housing inflation. The Fed’s tools for promoting housing supply are at best limited. In fact, further tightening of monetary policy will hurt housing supply by increasing the cost of AD&C financing. This can be seen on the graph below, as shelter costs continue to rise despite Fed policy tightening. Nonetheless, the NAHB forecast expects to see shelter costs decline further later in 2023, supported by real-time data from private data providers that indicate a cooling in rent growth. The Bureau of Labor Statistics (BLS) reported that the Consumer Price Index (CPI) rose by 0.2% in June on a seasonally adjusted basis, following an increase of 0.1% in May. The price index for a broad set of energy sources rose by 0.6% in June as the increase in gasoline index (+1.0%) and electricity index (+0.9%) more than offset the declines in natural gas index (-1.7%) and fuel oil index (-0.4%).  Excluding the volatile food and energy components, the “core” CPI rose by 0.2% in June, following an increase of 0.4% over the past three months. Meanwhile, the food index increased by 0.1% in June with the food at home index remained unchanged. In June, the indexes for shelter (+0.4%), motor vehicle insurance (1.7%) and apparel (0.3%) were the largest contributors to the increase in the headline CPI. Meanwhile, the indexes for airline fares (-8.1%), communication (-0.5%) as well as household furnishings and operations (-0.1%) declined in June. The index for shelter, which makes up more than 40% of the “core” CPI, rose by 0.4% in June, following an increase of 0.6% in May. The indexes for owners’ equivalent rent (OER) increased by 0.4% and rent of primary residence (RPR) increased by 0.5% over the month. Monthly increases in OER have averaged 0.6% over the last six months. These gains have been the largest contributors to headline inflation in recent months. During the past twelve months, on a not seasonally adjusted basis, the CPI rose by 3.0% in June, following a 4.0% increase in May. This was the slowest annual gain since March 2021. The “core” CPI increased by 4.8% over the past twelve months, following a 5.3% increase in May. The food index rose by 5.7% while the energy index fell by 16.7% over the past twelve months. NAHB constructs a “real” rent index to indicate whether inflation in rents is faster or slower than overall inflation. It provides insight into the supply and demand conditions for rental housing. When inflation in rents is rising faster (slower) than overall inflation, the real rent index rises (declines). The real rent index is calculated by dividing the price index for rent by the core CPI (to exclude the volatile food and energy components). The Real Rent Index rose by 0.3% in June. Related ‹ Consumer Credit Growth Slows to 30-Month LowTags: BLS, cpi, inflation, shelter index

CPI Eases Further as Housing Inflation Slows2023-07-12T09:16:44-05:00

Building Materials Prices Fall for Second Month Straight

2023-06-15T13:18:55-05:00

According to the latest Producer Price Index report, the prices of inputs to residential construction less energy (i.e., building materials) decreased 0.1% in May 2023 (not seasonally adjusted), following a 0.2% drop in April. The index has gained 0.3%, year-to-date, a stark contrast from the 10.2% and 4.9% YTD increases seen in 2021 and 2022, respectively.  The PPI for goods inputs to residential construction, including energy, declined 0.5% as energy prices drove the index lower. The index has declined 2.7% over the past 12 months but is 36.0% higher than it stood in January 2020. Gypsum Building Materials The PPI for gypsum building materials fell 1.1% for the second month straight and is down 0.4%, year-to-date. Gypsum building materials prices are 4.0% higher than they were a year ago but at the lowest level since July 2022. Softwood Lumber The PPI for softwood lumber (seasonally adjusted) decreased 3.1% after increasing 6.2% the prior month. Softwood lumber prices have declined 10 of the past 12 months and are 41.9% lower than they were one year ago. Ready-Mix Concrete Ready-mix concrete (RMC) prices were revised down for April in the latest release. As a result, prices declined last month for the first time since March 2022. Unfortunately, price growth returned in May as the RMC index increased 1.6%–the largest monthly increase in nearly a year. RMC prices have risen 2.8% YTD—the same increase seen through May 2022—and are up 13.0% over the past 12 months. Steel Mill Products Steel mill products price growth continued to accelerate in May as the index rose 5.2%. This comes on the heels of 3.5% and 1.0% increases in April and March, respectively. after climbing 3.1% in February and March combined. The PPI for steel mill products declined eight consecutive months ending in January, falling 27.9% over that span. However, prices have climbed 12.4% in the four months since. Services The price index of services inputs to residential construction decreased 1.0% in May after rising 0.5% in April. Prices have declined 12.4% over the past year but have been relatively stable in 2023, down just 0.5% through May. Related ‹ A Hawkish Pause: Landing Flare for the Fed?Tags: Building Materials, building materials prices, construction costs, Gypsum, inflation, lumber, ppi, producer price index, ready-mix concrete, softwood lumber, steel

Building Materials Prices Fall for Second Month Straight2023-06-15T13:18:55-05:00

About My Work

Phasellus non ante ac dui sagittis volutpat. Curabitur a quam nisl. Nam est elit, congue et quam id, laoreet consequat erat. Aenean porta placerat efficitur. Vestibulum et dictum massa, ac finibus turpis.

Recent Works

Recent Posts