Producer Prices Rise in May: New Construction Input Analysis
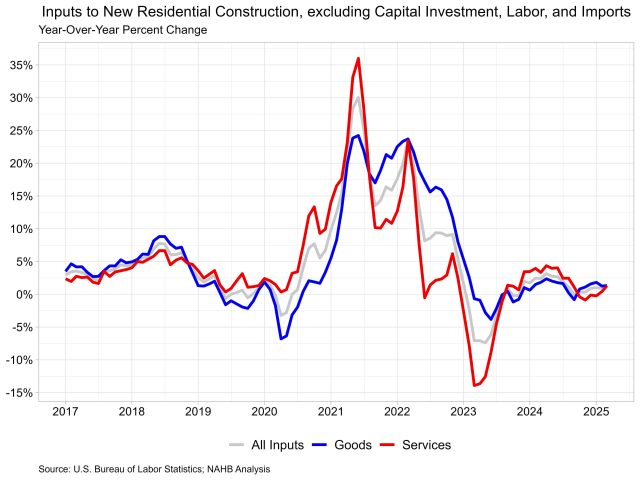
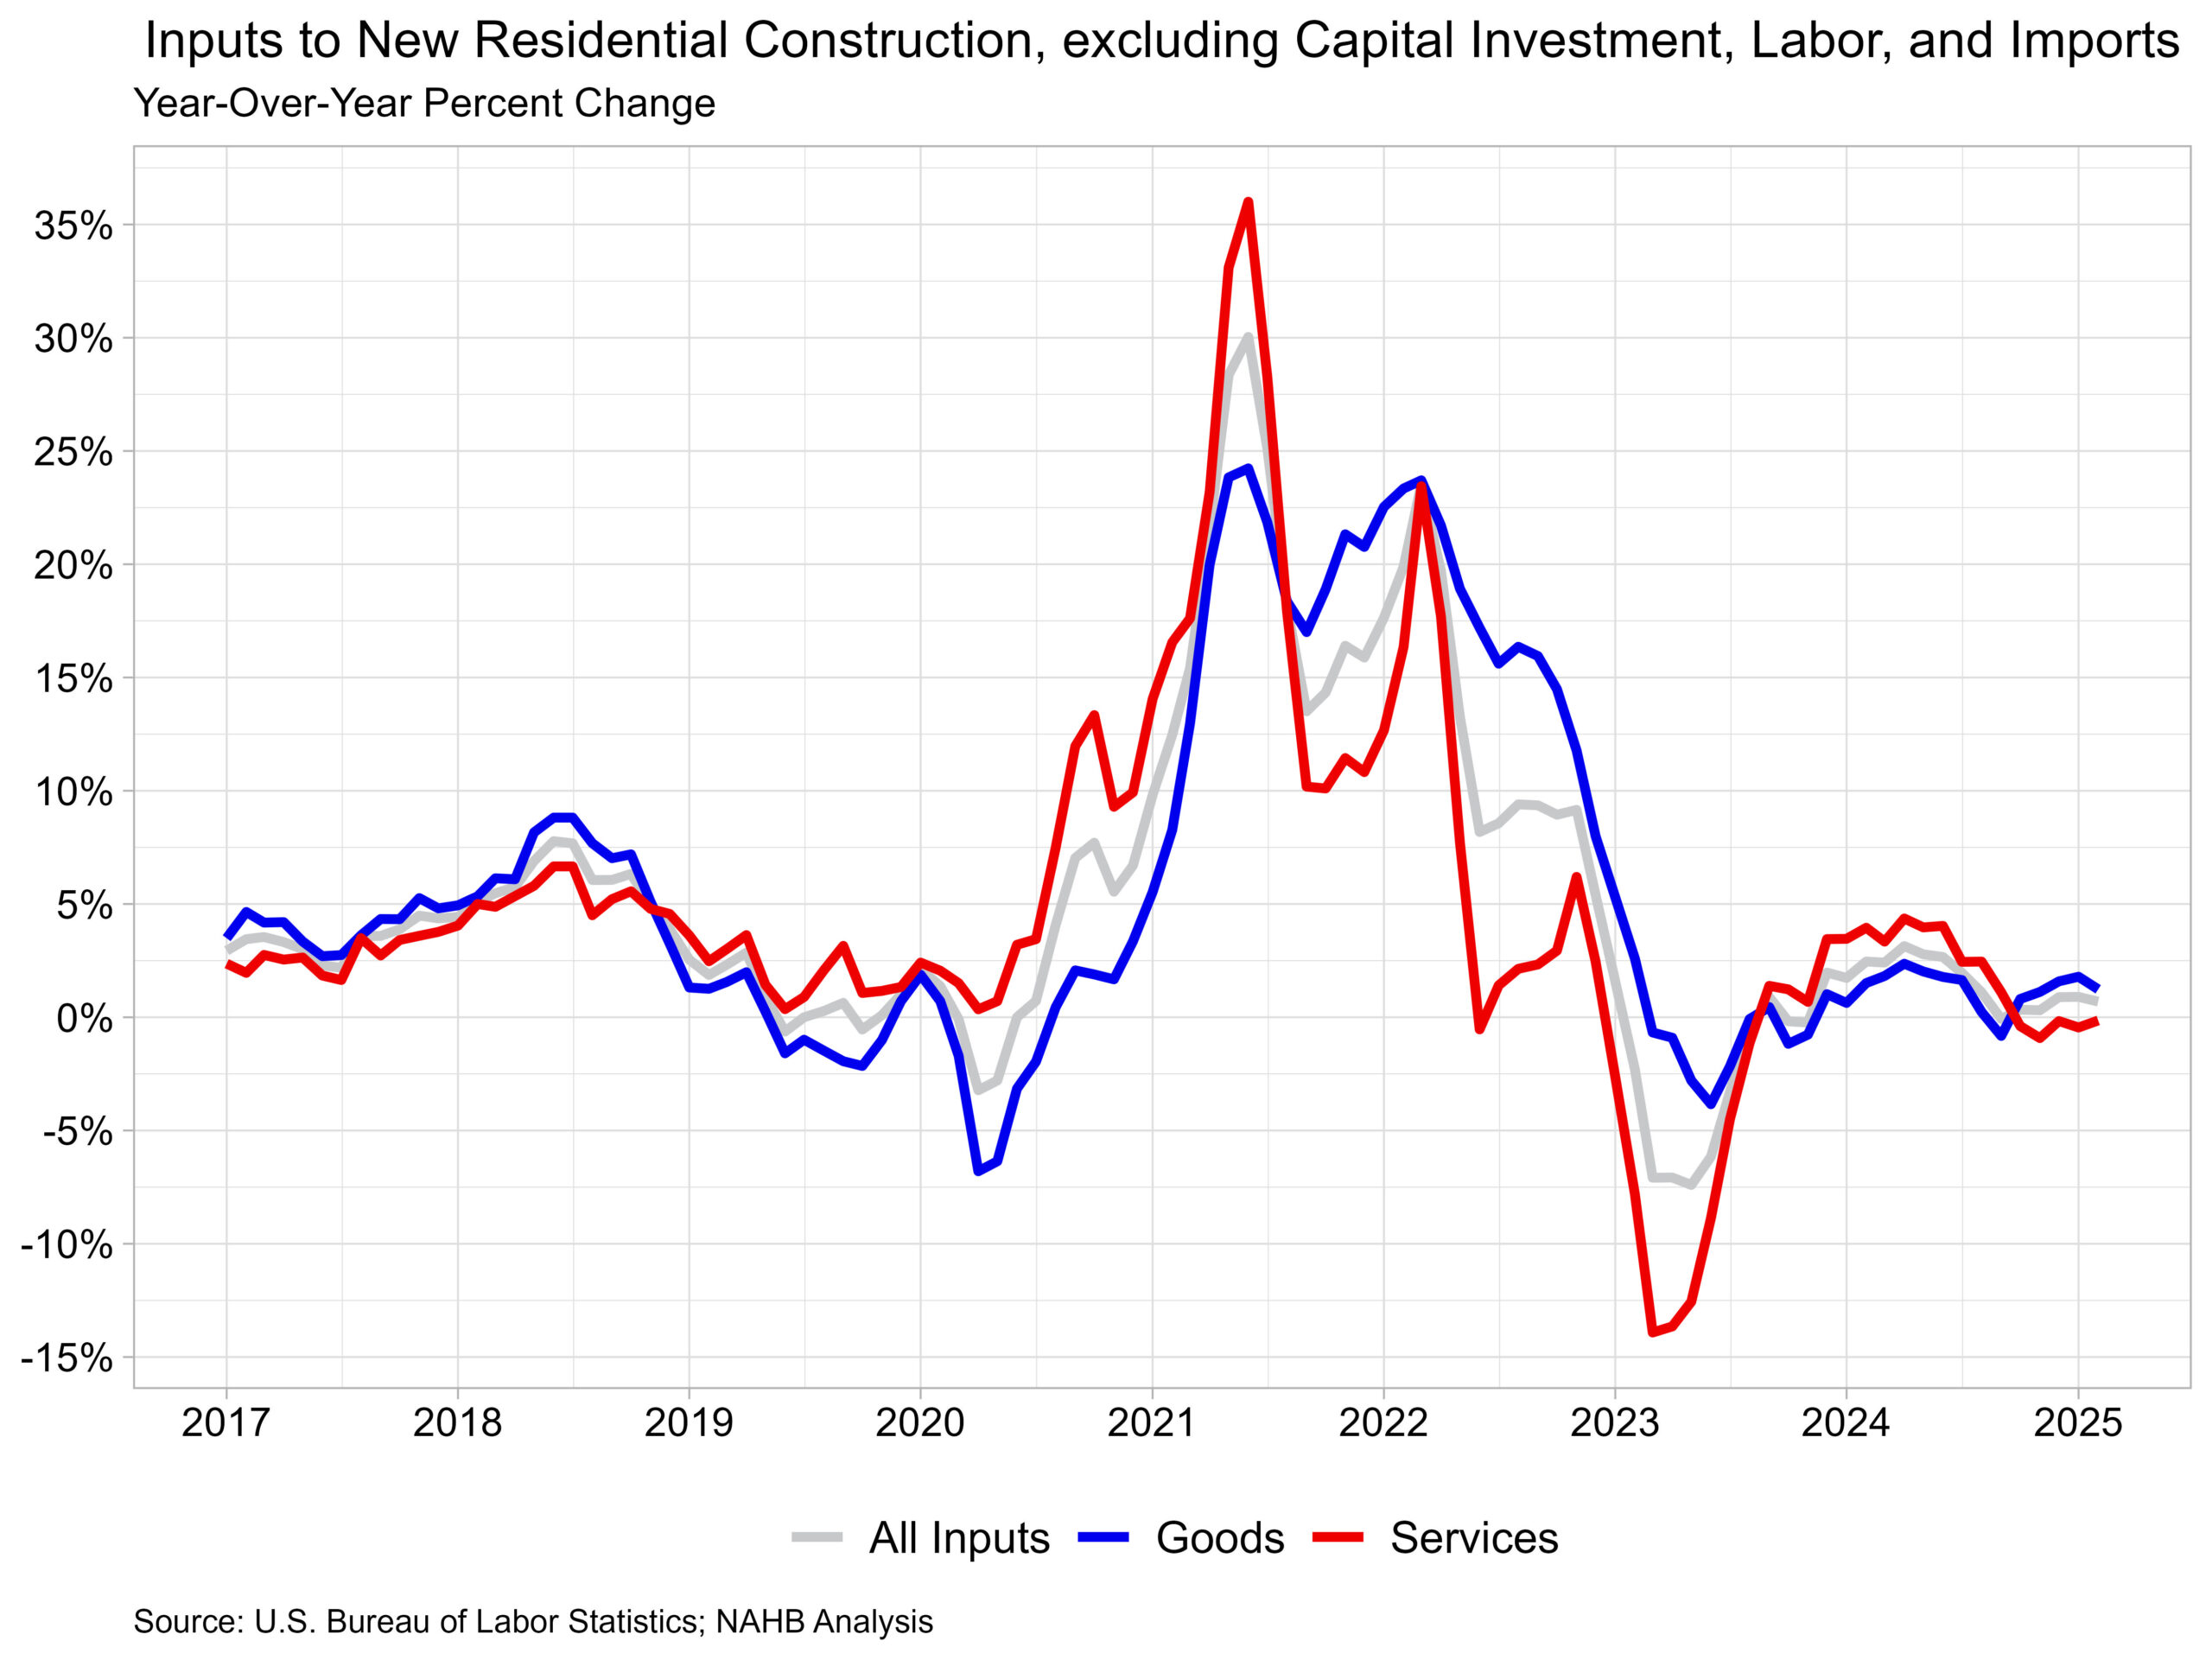
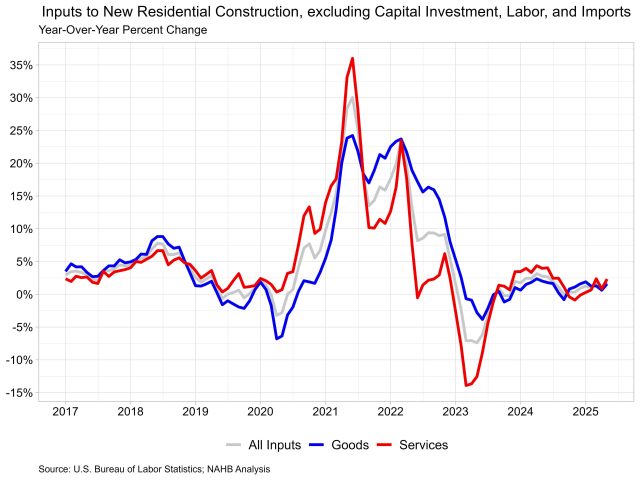
Jesse Wade2025-06-12T11:21:16-05:00Prices for inputs to new residential construction—excluding capital investment, labor, and imports—rose 0.2% in May, following a (revised) decrease of 0.2% in April. These figures are taken from the most recent Producer Price Index (PPI) report published by U.S. Bureau of Labor Statistics. The PPI measures prices that domestic producers receive for their goods and services; this differs from the Consumer Price Index which measures what consumers pay and includes both domestic products as well as imports. The inputs to the New Residential Construction Price Index grew 1.9% from May of last year. The index can be broken into two components—the goods component increased 1.6% over the year, with services increasing 2.3%. For comparison, the total final demand index, which measures all goods and services across the economy, increased 2.6% over the year, with final demand with respect to goods up 1.3% and final demand for services up 3.2% over the year. Input Goods The goods component has a larger importance to the total residential construction inputs price index, representing around 60%. For the month, the price of input goods to new residential construction was up 0.1% in May. The input goods to residential construction index can be further broken down into two separate components, one measuring energy inputs with the other measuring remaining goods. The latter of these two components simply represents building materials used in residential construction, which makes up around 93% of the goods index. Energy input prices were up 0.8% between April and May but were 9.8% lower than one year ago. Building material prices were up 0.1% between April and May while up 2.5% compared to one year ago. Across building material inputs, the commodity with the largest monthly increase in May was parts for construction machinery and equipment, which increased 6.8% after increasing 8.4% in April. Input Services Prices for service inputs to residential construction reported an increase of 0.3% in May. On a year-over-year basis, service input prices are up 2.3%. The price index for service inputs to residential construction can be broken out into three separate components: a trade services component, a transportation and warehousing services component, and a services excluding trade, transportation and warehousing component (other services). The most significant component is trade services (around 60%), followed by other services (around 29%), and finally transportation and warehousing services (around 11%). The largest component, trade services, was up 2.9% from a year ago. The other services component was up 1.4% over the year. Lastly, prices for transportation and warehousing services advanced 1.8% compared to May of last year. Inputs to New Construction Satellite Data Within the PPI that BLS publishes, new experimental data was recently published regarding inputs to new construction. The data expands existing inputs to industry indexes by incorporating import prices with prices for domestically produced goods and services. With this additional data, users can track how industry input costs are changing among domestically produced products and imported products. This data focuses on new construction, but the complete dataset includes indices across numerous industries, found here. New Construction input prices are primarily influenced by domestically produced goods and services, with domestic products accounting for 90% of the weight of the industry index for new construction. Imported goods make up the remaining 10% of the index. The latest available data, for March 2025, showed that domestically produced goods have experienced faster price growth compared to imported goods used in new construction. On a year-over-year basis, the index for domestic goods increased 0.8%, while prices for imported inputs fell 2.1% over the same period. Across all inputs to new construction, services prices have risen more than good inputs over the past year, as domestic services prices rose 2.2%. Across the three indexes, all inputs remain at higher levels compared to pre-pandemic prices. Discover more from Eye On Housing Subscribe to get the latest posts sent to your email.