State Level Employment Situation: August 2024

2024-10-08T09:16:59-05:00

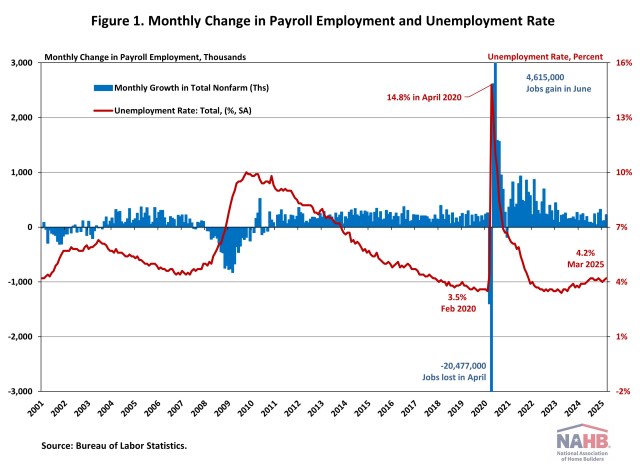
Nonfarm payroll employment increased in 32 states in August compared to the previous month, while 17 states and the District of Columbia saw a decrease. Kansas reported no change. According to the Bureau of Labor Statistics, nationwide total nonfarm payroll employment increased by 142,000 in August, following a gain of 89,000 jobs in July. On a month-over-month basis, employment data was most favorable in Texas, which added 78,000 jobs. Texas accounted for more than half the jobs created nationwide in August. Indiana came in second (+19,800), followed by Minnesota (+14,400). A total of 42,400 jobs were lost across the 17 states and the District of Columbia, with New York reporting the steepest job losses at 7,400. In percentage terms, employment increased the highest in Texas and Indiana at 0.6%, while South Dakota saw the biggest decline at 0.7% between July and August. Year-over-year ending in August, 2.4 million jobs have been added to the labor market across all 50 states and the District of Columbia. The range of job gains spanned from 1,500 jobs in South Dakota to 302,400 jobs in Texas. In percentage terms, the range of job growth spanned 3.3% in Missouri to 0.3% in South Dakota. Across the nation, construction sector jobs data1 —which includes both residential and non-residential construction—showed that 27 states and the District of Columbia reported an increase in August compared to July, while 20 states lost construction sector jobs. The three remaining states reported no change on a month-over-month basis. Texas, with the highest increase, added 8,300 construction jobs, while California, on the other end of the spectrum, lost 3,300 jobs. Overall, the construction industry added a net 34,000 jobs in August compared to the previous month. In percentage terms, Wyoming reported the highest increase at 2.3% and Tennessee reported the largest decline at 1.6%. Year-over-year, construction sector jobs in the U.S. increased by 228,000, which is a 2.8% increase compared to the August 2023 level. Texas added 36,600 jobs, which was the largest gain of any state, while Maryland lost 4,800 construction sector jobs. In percentage terms, Alaska had the highest annual growth rate in the construction sector at 17.8%. Over this period, Maine reported the largest decline of 4.7%. For this analysis, BLS combined employment totals for mining, logging, and construction are treated as construction employment for the District of Columbia, Delaware, and Hawaii. ↩︎ Discover more from Eye On Housing Subscribe to get the latest posts sent to your email.

State Level Employment Situation: August 20242024-10-08T09:16:59-05:00

Strong Job Market in September

2024-10-04T11:28:08-05:00

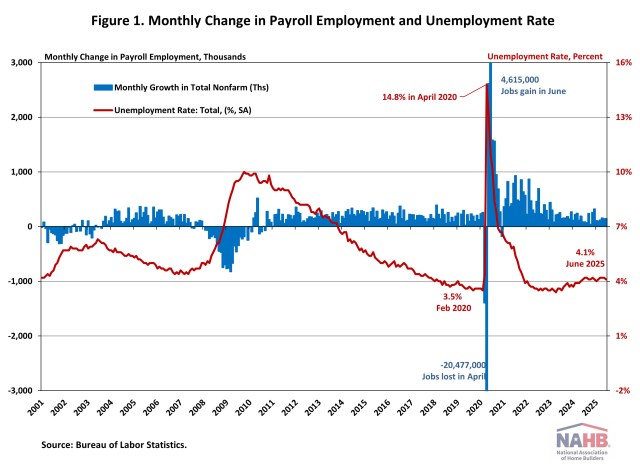
The September jobs report indicates that the U.S. labor market remains strong. Job growth accelerated, and the unemployment rate fell to a three-month low of 4.1%.  Meanwhile, job growth for the previous two months (July and August) was upwardly revised. In September, wage growth accelerated for the second straight month. Wages grew at a 4.0% year-over-year (YOY) growth rate in September, down 0.5 percentage points from a year ago. Wage growth is outpacing inflation, which typically occurs as productivity increases. National Employment Total nonfarm payroll employment increased by 254,000 in September, following an upwardly revised increase of 159,000 jobs in August, as reported in the Employment Situation Summary. It marks the largest monthly job gain in the past six months. The estimates for the previous two months were revised higher. The monthly change in total nonfarm payroll employment for July was revised up by 55,000, from +89,000 to +144,000, while the change for August was revised up by 17,000 from +142,000 to +159,000. Combined, the revisions were 72,000 higher than previously reported. In the first nine months of 2024, 1,801,000 jobs were created. Additionally, monthly employment growth averaged 200,000 per month, compared with the 251,000 monthly average gain for 2023. The Fed’s easing cycle began on September 18, marking the end of a period of restrictive monetary policy. The U.S. economy has created roughly 8 million jobs since March 2022, when the Fed enacted the first interest rate hike of this cycle. The unemployment rate fell slightly to 4.1% in September, from 4.2% in August. The September decrease in the unemployment rate reflected the decrease in the number of persons unemployed (-281,000) and the increase in the number of persons employed (+430,000). Meanwhile, the labor force participation rate—the proportion of the population either looking for a job or already holding a job—was 62.7% for the third consecutive month. However, for people aged between 25 and 54, the participation rate dipped slightly to 83.8%. This rate exceeds the pre-pandemic level of 83.1%. Meanwhile, the overall labor force participation rate is still below its pre-pandemic levels when it stood at 63.3% at the beginning of 2020. In September, employment continued to trend up in food services and drinking places (+69,000), health care (+45,000), government (+31,000), social assistance (+27,000), and construction (+25,000). Construction Employment Job gains in the overall construction sector continued in September, averaging 20,000 per month over the past 12 months. While residential construction gained 7,800 jobs, non-residential construction employment added 17,900 jobs for the month. Residential construction employment now stands at 3.4 million in September, broken down as 952,000 builders and 2.4 million residential specialty trade contractors. The 6-month moving average of job gains for residential construction was 3,450 a month. Over the last 12 months, home builders and remodelers added 60,500 jobs on a net basis. Since the low point following the Great Recession, residential construction has gained 1,393,800 positions. In September, the unemployment rate for construction workers rose to 4.9% on a seasonally adjusted basis. The unemployment rate for construction workers has remained at a relatively lower level, after reaching 15.3% in April 2020 due to the housing demand impact of the COVID-19 pandemic. Discover more from Eye On Housing Subscribe to get the latest posts sent to your email.

Strong Job Market in September2024-10-04T11:28:08-05:00

August Job Gain Led by Construction

2024-09-06T13:15:23-05:00

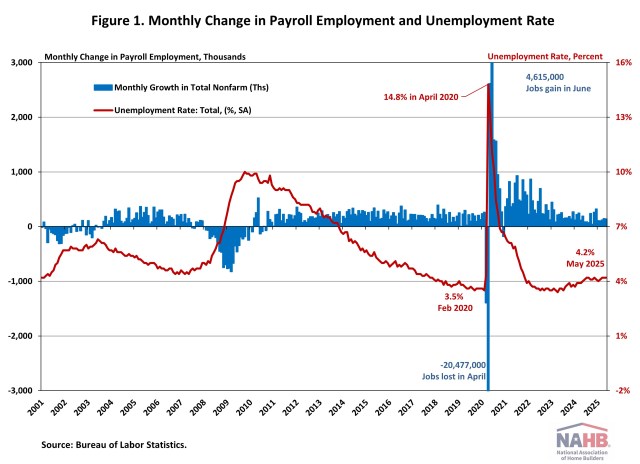
Today’s jobs report and the newly released preliminary estimate of the benchmark revision indicate that the U.S. labor market is slowing from its overheated state in 2021 and 2022 but remains stable. Among all sectors, construction led the August job gains, adding 34,000 jobs to payrolls. Additionally, wage growth accelerated in August. Wages grew at a 3.8% year-over-year (YOY) growth rate, down 0.7 percentage points from a year ago. Wage growth is outpacing inflation, which typically occurs as productivity increases. National Employment Total nonfarm payroll employment increased by 142,000 in August, following a downwardly revised increase of 89,000 jobs in July, as reported in the Employment Situation Summary. The estimates for the previous two months were revised lower. The monthly change in total nonfarm payroll employment for June was revised down by 61,000, from +179,000 to +118,000, while the change for July was revised down by 25,000 from +114,000 to +89,000. Combined, the revisions were 86,000 lower than the original estimates. Despite restrictive monetary policy, about 7.9 million jobs have been created since March 2022, when the Fed enacted the first interest rate hike of this cycle. In the first eight months of 2024, 1,475,000 jobs were created. Additionally, monthly employment growth averaged 184,000 per month, compared with the 251,000 monthly average gain for 2023. In August, the unemployment rate eased slightly to 4.2%, from 4.3% in July. The August decrease in the unemployment rate reflected the decrease in the number of persons unemployed (-48,000) and the increase in the number of persons employed (+168,000). Meanwhile, the labor force participation rate—the proportion of the population either looking for a job or already holding a job—remained at 62.7%. However, for people aged between 25 and 54, the participation rate dipped slightly to 83.9%. This rate exceeds the pre-pandemic level of 83.1%. Meanwhile, the overall labor force participation rate is still below its pre-pandemic levels when it stood at 63.3% at the beginning of 2020. For industry sectors, construction (+34,000), health care (+31,000), and social assistance (+13,000) had job gains in August, while manufacturing lost 24,000 jobs. Employment in other major industries showed little change over the month. Construction Employment Employment in the overall construction sector in August (+34,000) experienced an increase, from the 13,000 job gains in July. While residential construction gained 5,600 jobs, non-residential construction employment added 28,300 jobs for the month. Residential construction employment now stands at 3.4 million in August, broken down as 951,000 builders and 2.4 million residential specialty trade contractors. The 6-month moving average of job gains for residential construction was 5,667 a month. Over the last 12 months, home builders and remodelers added 63,100 jobs on a net basis. Since the low point following the Great Recession, residential construction has gained 1,385,000 positions. In August, the unemployment rate for construction workers declined to 3.9% on a seasonally adjusted basis. The unemployment rate for construction workers has remained at a relatively lower level, after reaching 15.3% in April 2020, due to the housing demand impact of the COVID-19 pandemic. Discover more from Eye On Housing Subscribe to get the latest posts sent to your email.
August Job Gain Led by Construction2024-09-06T13:15:23-05:00

Construction Labor Market is Cooling

2024-09-04T10:16:54-05:00

Due to slowing home construction and elevated interest rates, the count of open construction sector jobs continued to decline in July, per the Bureau of Labor Statistics’ Job Openings and Labor Turnover Survey (JOLTS). However, this shift lower is also consistent with a cooler overall labor market, which is a positive sign for future inflation readings and the interest rate outlook. In July, after revisions, the number of open jobs for the overall economy decreased slightly from 7.91 million to 7.67 million. This is notably smaller than the 8.81 million estimate reported a year ago. Previous NAHB analysis indicated that this number had to fall below 8 million on a sustained basis for the Federal Reserve to feel more comfortable about labor market conditions and their potential impacts on inflation. With estimates now measurably below 8 million, interest rate cuts from the Federal Reserve are at hand (Indeed, the yield curve reversed its inversion for the first time since June 2022 today, although this reversion can also be a bond market signal for some concern for future macro data). As the Fed eases monetary policy, the demand for new construction will expand. Thus, a reversal for the current soft readings for construction labor will occur in the quarters ahead. This means the underlying skilled labor shortage is likely to persist during the coming years. In July, the number of open construction sector jobs shifted notably lower from 299,000 in June to 248,000. Elements of the construction sector have slowed as elevated interest rates held, most notably multifamily development. This slowing has somewhat reduced demand for construction workers, lowering the job opening count for the construction industry. The open job count was 351,000 a year ago. The construction job openings rate fell to 2.9% in July, the lowest rate since March 2020. The job openings rate has trended lower as the number of single-family and multifamily residences under construction has declined. This is a cyclical effect that will likely reverse later in 2025. The layoff rate in construction increased to 2.1% in July from 1.3% in June as the labor market slows. The quits rate in construction increased to 2.1% in July from 1.6% in June. The rise in the layoff rate is consistent with a slowing construction labor market. Discover more from Eye On Housing Subscribe to get the latest posts sent to your email.

Construction Labor Market is Cooling2024-09-04T10:16:54-05:00

The Rise of White-Collar Jobs in Construction

2024-08-27T08:20:50-05:00

Analysis of the history of data from the American Community Survey (ACS) reveals dramatic shifts in the makeup of the construction labor force over the last two decades. While the overall count of workers in the industry now approaches the historic highs of the housing boom of 2005-2006, the share of tradesmen declined from 71% in 2005 to under 61% in 2022. At the same time, the share of computer, engineering, and science occupations doubled, and the share of management and business occupations increased 60%. The results are noteworthy, particularly given a recent focus on relatively flat productivity growth in the construction sector. A growing count of engineering/tech workers would, on its face, suggest a boost to productivity. However, a decline for the share of workers associated with the trades could suggest declining productivity. Indeed, more workers in management and business occupations could be another impact of the rising regulatory burden associated with building. These findings and possible impacts deserve additional research attention given the need to supply more attainable housing to the market. As of 2022, the construction labor force exceeds 11.7 million, just slightly below the housing boom peak of 12 million. Construction trades (such as carpenters, electricians, painters, plumbers, laborers, as well as first-line supervisors) account for 7.1 million workers in the industry, or 60.7%. In contrast, there were 8.5 million construction tradesmen during the peak employment of 2006. The disappearance of more than a million craftsmen helps explain the persistent labor shortages reported by the NAHB/Wells Fargo Housing Market Index Survey. Over the same period, the construction industry absorbed a rising number of white-collar workers. The management ranks expanded from 1.2 million to 1.9 million workers, and their share increased from 10% to 16%. Business and financial occupations grew at similar rates. The number of engineers, architects and other science occupations doubled; they now account for close to 2.7% of the industry workforce. In contrast, the share of computer, engineering and science occupations was just 1.3% in 2005. Even though the prevalence of white-collar jobs in construction remains less common than in the US economy overall, their numbers and shares have been rising faster in construction since 2005. For example, while the share of computer, engineering, and science occupations doubled in construction, it increased only 40% in the overall US workforce. Similarly, whereas the management ranks increased 60% in construction, they grew at a slower rate for the US labor force and registered gains of 45% since 2005. The rising presence of white-collar workers in construction undoubtedly reflects evolving production technologies, an enhanced regulatory environment and more stringent building codes. The changing makeup of the construction workforce also coincides with the declining rates of self-employment in the industry and may reflect a shift towards larger construction firms. Larger building enterprises are better equipped to invest into new technologies and absorb higher overhead costs. The labor force statistics reported in the post are tabulated using the historic ACS Public Use Microdata Sample (PUMS). The ACS statistics are most comprehensive as they include payroll workers, as well as self-employed. As the common practice dictates, the labor force estimates count employed and those unemployed workers who look for jobs. Discover more from Eye On Housing Subscribe to get the latest posts sent to your email.

The Rise of White-Collar Jobs in Construction2024-08-27T08:20:50-05:00

Construction: 45,000 Fewer Jobs Created than Estimated

2024-08-22T12:20:01-05:00

The labor market may not be as strong as previously estimated, according to the Bureau of Labor Statistics’ preliminary estimate of the upcoming annual benchmark revision to the establishment survey employment series. Each year, the Current Employment Statistics (CES) survey employment estimates are benchmarked to full population counts of employment for the month of March. It improves the accuracy of the CES all-employee series and provides an early look at adjustments to employment data. According to the preliminary estimate of the benchmark revision, total payroll employment for the period from April 2023 to March 2024 (12 months) was lowered by 818,000, about 0.5% less than previously estimated. If the final benchmark revision is not far off the preliminary one, this preliminary estimate of the upcoming annual benchmark revision would be the largest downward revision since March of 2009 (the 2009 revision was a reduction of 902,000 estimated jobs). Additionally, while the CES data show that 2.9 million jobs were added from April 2023 to March 2024, the preliminary estimate of the benchmark revision suggests that job growth was overstated by about 40%. On a monthly basis, there were about 68,000 fewer jobs on average in the 12-month period through March 2024. Among major industry sectors, five sectors saw an upward revision in employment, led by private education and health services (+87,000) and transportation and warehousing (+56,400). Meanwhile, professional and business services had the largest downward revision of 358,000 jobs, followed by leisure and hospitality shedding 150,000 jobs. Closer to housing, construction employment was revised down by 45,000, 0.6% less than the initially reported 8.2 million jobs in place. The average monthly job gains for the construction sector were revised down by 17% to 18,000 jobs in the 12-month period through March 2024. Figure 1 shows the level difference between revised employment data and previous estimates for the construction sector from 2007 to 2024. The red bars mark the downward revisions, while the blue bars present the upward revisions. From top to bottom, there are three consecutive red bars from 2009 to 2011, another three red bars from 2019 to 2021, and the last one in 2024. During the period of the 2008 recession and the COVID-19 pandemic, construction employment was overestimated for three straight years, respectively. The current preliminary benchmark revision for the construction sector is the largest downward revision since March 2010. Note: The existing employment data will not be updated with the release of the preliminary benchmark estimate. The data for all CES series will be updated when the final benchmark revision is issued in February 2025. Discover more from Eye On Housing Subscribe to get the latest posts sent to your email.

Construction: 45,000 Fewer Jobs Created than Estimated2024-08-22T12:20:01-05:00

State Level Employment Situation: July 2024

2024-08-21T09:14:53-05:00

Nonfarm payroll employment increased in 28 states in July compared to the previous month, while 22 states saw a decrease. The District of Columbia reported no change. According to the Bureau of Labor Statistics, nationwide total nonfarm payroll employment increased by 114,000 in July, following a gain of 179,000 jobs in June. On a month-over-month basis, employment data was most favorable in New York, which added 41,400 jobs, followed by Florida (+21,800), and then California (+21,100). A total of 81,700 jobs were lost across the 22 states, with Missouri reporting the steepest job losses at 22,400. In percentage terms, employment increased the highest in Vermont at 0.5%, while Missouri saw the biggest decline at 0.7% between June and July. Year-over-year ending in July, 2.5 million jobs have been added to the labor market across all 50 states and the District of Columbia. The range of job gains spanned from 1,900 jobs in Wyoming to 284,400 jobs in California. In percentage terms, the range of job growth spanned 3.7% in South Carolina to 0.4% in Oregon. Across the nation, construction sector jobs data[1]—which includes both residential and non-residential construction—showed that 29 states and the District of Columbia reported an increase in July compared to June, while 16 states lost construction sector jobs. The five remaining states reported no change on a month-over-month basis. Florida, with the highest increase, added 6,300 construction jobs, while New York, on the other end of the spectrum, lost 3,800 jobs. Overall, the construction industry added a net 25,000 jobs in July compared to the previous month. In percentage terms, Tennessee reported the highest increase at 3.3% and Arkansas reported the largest decline at 1.2%. Year-over-year, construction sector jobs in the U.S. increased by 239,000, which is a 3.0% increase compared to the July 2023 level. Florida added 36,700 jobs, which was the largest gain of any state, while New York lost 8,100 construction sector jobs. In percentage terms, Alaska had the highest annual growth rate in the construction sector at 19.9%. Over this period, Maine reported the largest decline of 4.1%. [1] For this analysis, BLS combined employment totals for mining, logging, and construction are treated as construction employment for the District of Columbia, Delaware, and Hawaii. Discover more from Eye On Housing Subscribe to get the latest posts sent to your email.

State Level Employment Situation: July 20242024-08-21T09:14:53-05:00

Labor Market Continues to Soften in July

2024-08-02T13:17:17-05:00

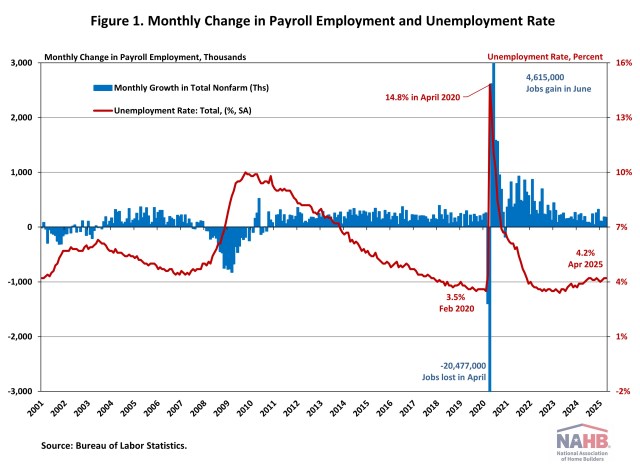
In July, job growth decelerated significantly, and the unemployment rate increased to a nearly three-year high of 4.3%. The July data indicates that the labor market is slowing, which signals monetary policy easing in the months ahead. Additionally, wage growth slowed for the second month in a row. In July, wages grew at a 3.6% year-over-year (YOY) growth rate, down 1.0 percentage point from a year ago. This marks the lowest YOY wage gain in the past four years. Total nonfarm payroll employment increased by 114,000 in July, following a downwardly revised increase of 179,000 jobs in June, as reported in the Employment Situation Summary. The estimates for the previous two months were revised down. The monthly change in total nonfarm payroll employment for May was revised down by 2,000, from +218,000 to +216,000, while the change for June was revised down by 27,000 from +206,000 to +179,000. Combined, the revisions were 29,000 lower than the original estimates. Despite restrictive monetary policy, nearly 7.8 million jobs have been created since March 2022, when the Fed enacted the first interest rate hike of this cycle. In the first seven months of 2024, 1,419,000 jobs were created. Additionally, monthly employment growth averaged 203,000 per month, compared with the 251,000 monthly average gain for 2023. In July, the unemployment rate rose for the fourth straight month to 4.3%, the highest rate since October 2021. The number of unemployed persons rose by 352,000, while the number of employed persons was barely changed. Meanwhile, the labor force participation rate, the proportion of the population either looking for a job or already holding a job, rose 1.0 percentage point to 62.7% for July. Moreover, the labor force participation rate for people aged between 25 and 54 ticked up to 84.0%, the highest level since March 2001. While the overall labor force participation rate is still below its pre-pandemic levels at the beginning of 2020, the rate for people aged between 25 and 54 exceeds the pre-pandemic level of 83.1%. For industry sectors, health care (+55,000), construction (+25,000), and transportation and warehousing (+14,000) have notable job gains in July, while information employment lost 20,000 jobs. Employment in the overall construction sector increased by 25,000 in July, after 20,000 gains in June. While residential construction gained 9,100 jobs, non-residential construction employment added 16,200 jobs for the month. Residential construction employment now stands at 3.4 million in July, broken down as 950,000 builders and 2.4 million residential specialty trade contractors. The 6-month moving average of job gains for residential construction was 6,067 a month. Over the last 12 months, home builders and remodelers added 67,600 jobs on a net basis. Since the low point following the Great Recession, residential construction has gained 1,387,400 positions. In July, the unemployment rate for construction workers rose to 4.4% on a seasonally adjusted basis. The unemployment rate for construction workers remained at a relatively lower level, after reaching 15.3% in April 2020, due to the housing demand impact of the COVID-19 pandemic. Discover more from Eye On Housing Subscribe to get the latest posts sent to your email.
Labor Market Continues to Soften in July2024-08-02T13:17:17-05:00

About My Work

Phasellus non ante ac dui sagittis volutpat. Curabitur a quam nisl. Nam est elit, congue et quam id, laoreet consequat erat. Aenean porta placerat efficitur. Vestibulum et dictum massa, ac finibus turpis.

Recent Works

Recent Posts