Building Material Prices Continued to Rise in September
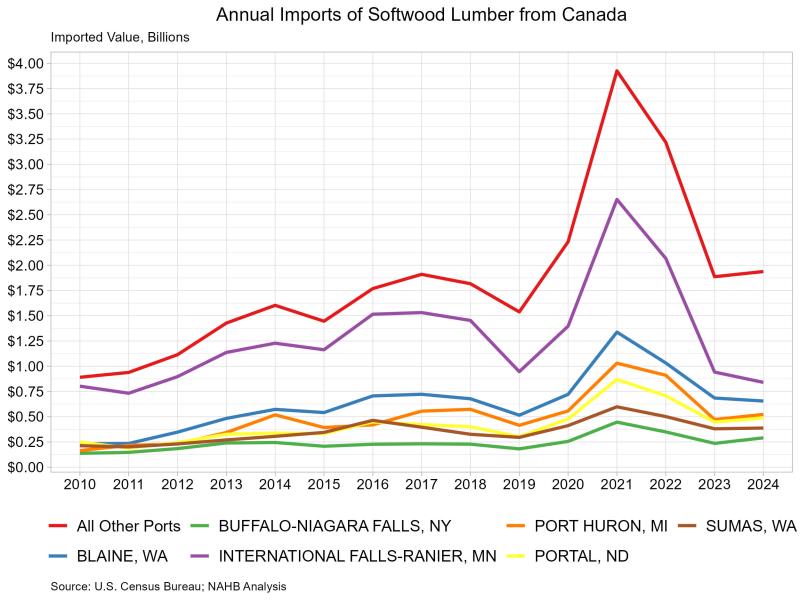
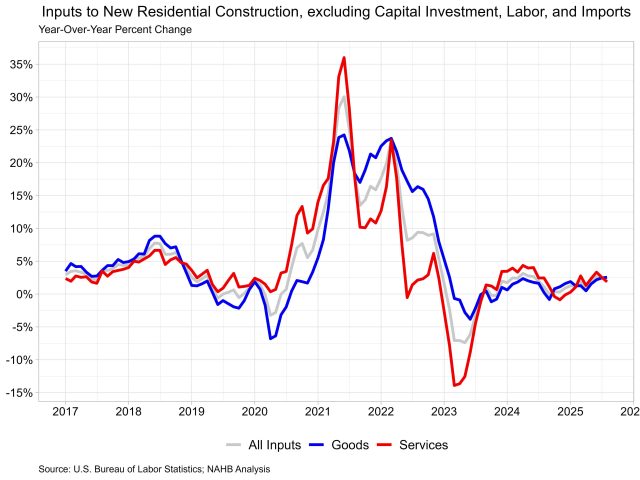
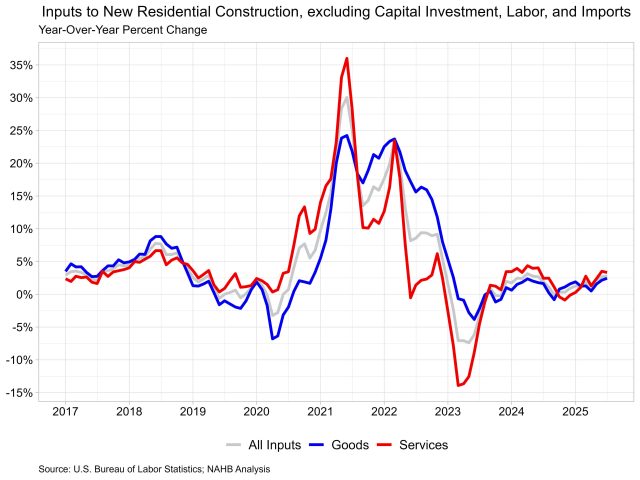
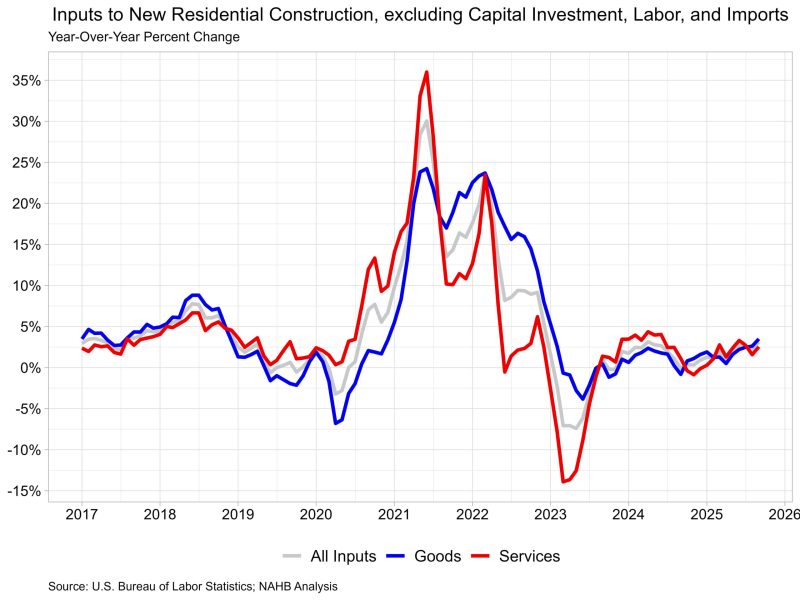
Web Master2025-11-25T11:18:14-06:00Aggregate residential building material prices rose at their fastest pace since January 2023 in the latest Producer Price Index release from the Bureau of Labor Statistics. Input energy prices increased for the first time in over a year, while service price growth remained lower than goods. The Producer Price Index for final demand increased 0.3% in September, after falling 0.1% in August. The index for final demand goods increased 0.9% in September, the largest monthly increase since February 2024. Final demand energy prices were responsible for most of the goods index increase, as they rose 3.5% in September. This index for final demand for services was unchanged in September. The price index for inputs to new residential construction rose 0.2% in September and was up 3.1% from last year. The price of goods inputs was up 0.1% over the month and 3.5% from last year, while prices for services were up 0.3% over the month and 2.5% from last year. Input Goods The goods component has a larger importance to the inputs to residential construction price index, representing around 60%. On a monthly basis, the price of input goods to new residential construction was up 0.1% in September. The input goods to residential construction index can be further broken down into two separate components, one measuring energy inputs with the other measuring remaining goods. The latter of these two components simply represents building materials used in residential construction, which makes up around 93% of the goods index. Energy input prices rose 1.0% in September and were 3.0% higher than one year ago. Building material prices were up 0.1% in September and up 3.5% compared to one year ago. The 3.5% year-over-year increase is the largest increase since the 4.9% experienced back in January 2023. Residential building material price inflation slowly accelerated over the year, after starting around 2.0%. The largest year-over-year price changes continue to be parts for construction machinery and equipment, sold separately, up 41.3% compared to September of last year. Metal molding and trim prices are up 31.0% from last year. Ready-mix concrete, a key input to new residential construction, has shown little price growth in 2025, up only 0.4% from last year. Additionally, softwood lumber prices were down 2.3% in September from last year. Lumber prices have experienced declines over the past few months despite higher tariffs now in place. Ongoing weaknesses during 2025 in new residential construction have led to an acute oversupply of lumber on the market, with demand below expectations. Input Services Prices for service inputs to residential construction reported an increase of 0.3% in September. On a year-over-year basis, service input prices were up 2.5%. The price index for service inputs to residential construction can be broken out into three separate components: a trade services component, a transportation and warehousing services component, and a services excluding trade, transportation and warehousing component (other services). The most significant component is trade services (around 60%), followed by other services (around 29%), and finally transportation and warehousing services (around 11%). The largest component, trade services, was up 3.1% from a year ago. The other services component was up 1.3% over the year. Lastly, prices for transportation and warehousing services rose 2.6% compared to August of last year.