Construction Labor Market Softens
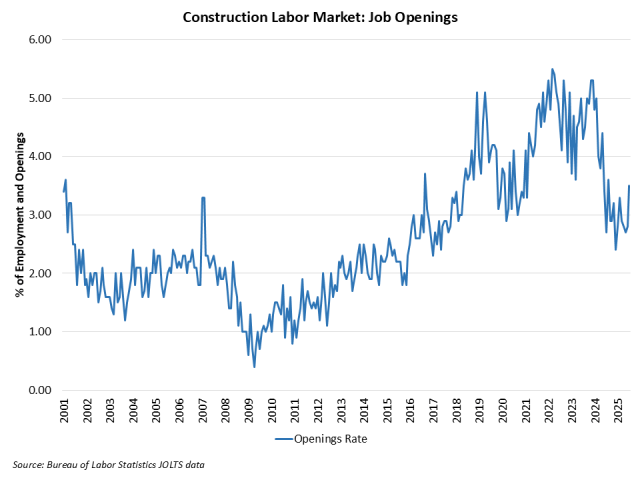
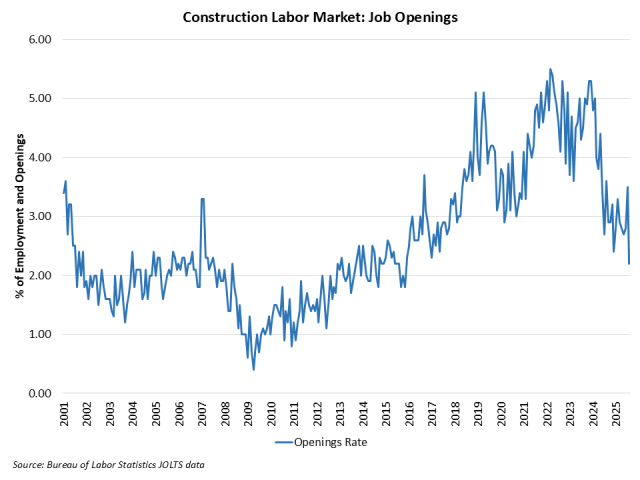
Web Master2025-09-30T10:20:27-05:00The count of open, unfilled positions in the construction industry decreased in August, per the Bureau of Labor Statistics Job Openings and Labor Turnover Survey (JOLTS). The decline occurred as home building weakened in 2025. The number of open jobs for the overall economy was effectively unchanged, increasing from 7.21 million in July to 7.23 million in August. The August reading was notably lower than the 7.65 million estimate from a year ago and reflects an overall cooling of the U.S employment market. Previous NAHB analysis indicated that this number had to fall below 8 million on a sustained basis for the Federal Reserve to move forward on interest rate reductions. With estimates remaining below 8 million for national job openings, the Fed, in theory, should be able to cut further in 2025. The number of open construction sector jobs decreased from a revised 303,000 level in July to 188,000 in August. This marks a notable decline of open, unfilled construction jobs from that registered a year ago (304,000). The chart below notes the declining trend that has been in place for unfilled construction jobs since the Fed raised the federal funds rate as home building weakened. The construction job openings rate declined to 2.2% in August, lower than the 3.6% estimated a year ago. The layoff rate in construction declined to 2.2% in August. The quits rate edged higher to 1.8% in August. Discover more from Eye On Housing Subscribe to get the latest posts sent to your email.