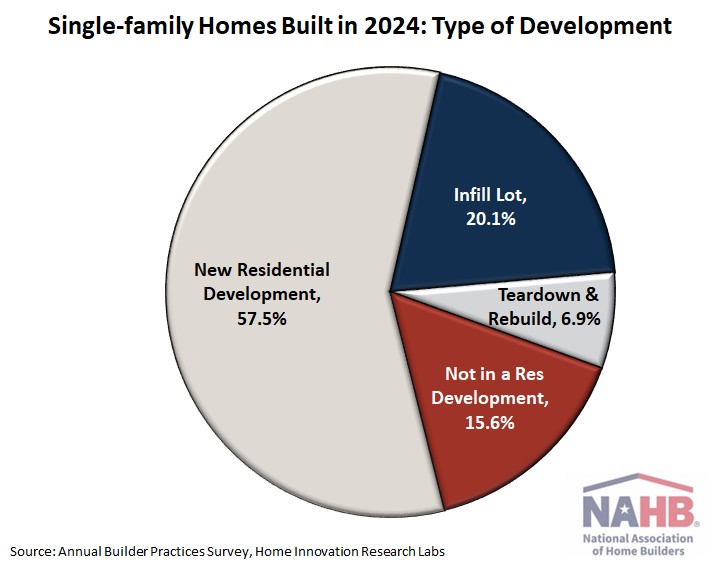
Which Local Markets Track National Trends the Most: 2024 Multifamily MAI

2025-11-07T11:15:55-06:00

Following the release of the 2024 single-family MAI last week, the National Association of Home Builders developed the Multifamily Market Association Index (MAI) to measure how closely multifamily building permits in metro areas follow national patterns. By comparing local and national trends, the MAI helps industry leaders and forecasters better understand and predict housing market activity. Nationally, multifamily permits displayed little variation over the second half of the 2010s. Permit levels began growing significantly during the pandemic and peaked at nearly 700,000 in 2022. However, both 2023 and 2024 reported declines, with 2024 having 496,000 units permitted, closer to pre-2020 levels. The MAI uses 2015-2024 multifamily permit data to create five- and ten-year correlations for each metropolitan statistical area (MSA), showing their similarity to national patterns. The five- and ten-year correlations are then averaged, with more weight given to the five-year correlation. The resulting correlation coefficient ranges from negative one to positive one, indicating the strength and direction of the relationship between local and national trends. The MSA that had the highest associations with the national trend was Clarksville, TN-KY with a correlation of 0.97, while the MSA that recorded the lowest association with the national trend was College Station-Bryan, TX. The scatter plot below illustrates the linear relationship between these MSAs and the national trend. For example, when national permit levels rose near 700,000, Clarksville (positive correlation) also had relatively high permit levels of around 2,500. At the same time, College Station-Bryan (negative correlation) had relatively low permits of about 230. Of the 387 metro areas included in the multifamily MAI, the average correlation is 0.17. In total, 241 MSAs had a correlation greater than zero, and 145 MSAs had less than zero. One MSA had an average correlation of zero (Morgantown, WV), with no multifamily permits in the last five years. A positive correlation is expected as MSAs in total accounted for almost 95% of all multifamily permits in the U.S. on average between 2015 and 2024. A complete list of the MSA correlations is found here and shown on the map below. Additionally, below are the top ten and bottom ten in terms of the Multifamily MAI. Discover more from Eye On Housing Subscribe to get the latest posts sent to your email.

Which Local Markets Track National Trends the Most: 2024 Multifamily MAI2025-11-07T11:15:55-06:00

Laundry Room Locations in New Homes and Apartments, 2024 

2025-11-03T11:16:15-06:00

In 2024, most new single-family homes included laundry connections on the first floor (70%), according to the Census Bureau’s Survey of Construction. The first floor is also where most customers prefer to have the laundry, as shown in Chapter 2 of What Home Buyers Really Want.      The second floor was the next most common location, accounting for 28% of new single-family homes, while laundry areas in the basement accounted for just 2%. The share of new homes with laundry in any other location was negligible.  Across all Census Divisions, the first floor remains the most common location for laundry, even in regions where two-story homes are more prevalent. Nevertheless, some regional differences exist. In the West South Central division, 91% of homes had a laundry area on the first floor, compared to just 51% in the Pacific division. Meanwhile, a second-floor laundry was most popular in the Pacific division at 46%, and least common in the West South Central at 8%.  Not surprisingly, laundry connections in basements are more common in areas of the country where basements themselves are more common: primarily in the northern regions. The West North Central division led with 14% of homes featuring a basement laundry, followed by New England at 9%. These two divisions are also among the few where most new homes include a full or partial basement.   Among age-restricted homes, where accessibility and main-level living are key design priorities, 93% featured laundry on the first floor.  Multifamily Laundry Trends For multifamily units completed in 2024, 88% of apartments included an individual laundry, while 12% offered shared or no laundry facilities. This share has remained relatively stable since 2015, reflecting continued renter demand for in-unit laundry.  Regionally, the Northeast has the highest shared or no laundry facilities percentage at 33%. In contrast, shared or no laundry facilities remained far less common elsewhere: 3% in the Midwest, 4% in the South, and 9% in the West.  The pattern extends to the built-for-rent (BFR) segment, where 88% of units had an individual laundry, unchanged from the prior two years. In contrast, built-for-sale multifamily units saw a decrease—from 92% with individual laundry in 2023 to 81% in 2024—suggesting a possible shift toward more affordable condo projects, which are more likely to include shared facilities.  Discover more from Eye On Housing Subscribe to get the latest posts sent to your email.

Laundry Room Locations in New Homes and Apartments, 2024 2025-11-03T11:16:15-06:00

Which Local Markets Track National Trends the Most: 2024 Single-Family MAI

2025-10-30T09:17:46-05:00

The National Association of Home Builders developed the Single-Family Market Association Index (MAI) to measure how closely single-family building permits in metro areas follow national patterns. By comparing local and national trends, the MAI helps industry leaders and forecasters better understand and predict housing market activity. The MAI uses 2015-2024 single permit data to create five- and ten-year correlations for each metropolitan statistical area (MSA), showing their similarity to national patterns. The five- and ten-year correlations are then averaged, with more weight given to the five-year correlation. The resulting correlation coefficient ranges from negative one to positive one, indicating the strength and direction of the relationship between local and national trends. The MSA that had one of the highest associations with the national trends was Odessa, Texas with a correlation of 0.97. Meanwhile, Boulder, Colorado, a similarly sized MSA, had the most negative correlation of -0.81. The scatter plot below illustrates the linear relationship between these MSAs and the national trend. For example, when national permit levels rose toward 1.1 million, Odessa (positive correlation) also has relatively high permit levels of around 1,400. At the same time, Boulder (negative correlation) has relatively low permits, below 400. Of the 387 metro areas included in the single-family MAI, the average correlation is 0.43. In total, 342 MSAs had a correlation greater than zero, and 45 MSAs had less than zero. A positive correlation is expected as MSAs in total accounted for almost 90% of all single-family permits in the U.S. on average between 2015 and 2024. A complete list of the MSA correlations is found here and shown on the map below. The MSA that most closely followed the national permit trend was San Antonio-New Braunfels, TX. Strong association was present throughout the South region. The West and Northeast regions are where many MSAs show weak association with the national permit trend. Below are tables of the top ten highest and lowest associated MSAs. A release of the Multifamily MAI will be followed in another post shortly. Discover more from Eye On Housing Subscribe to get the latest posts sent to your email.

Which Local Markets Track National Trends the Most: 2024 Single-Family MAI2025-10-30T09:17:46-05:00

Two-Story Foyer Trend Stabilize in 2024

2025-10-27T11:17:19-05:00

In 2024, nearly a quarter of new homes were built with a two-story foyer, virtually unchanged from 2023, according to data obtained from the Census Bureau’s Survey of Construction (SOC) and tabulated by NAHB. The market share of two-story foyers has been generally trending downward over the past eight years, with most new single-family homes being built without a two-story foyer nationally and regionally.   According to the Census, a two-story foyer is defined as the entranceway inside the front door of a house and has a ceiling that is at the level of the second-floor ceiling. In the United States, the share of new homes with two-story foyers slightly fell from 24.9% to 24.6% in 2024, the lowest level since NAHB began tracking this data in 2017. This feature is often considered energy-inefficient and is seen as undesirable by both builders and buyers. The declining trend is in line with NAHB’s What Home Buyer’s Really Want, in which recent and prospective buyers rated their preference for 18 specialty rooms. The study found that two-story entry foyers was one of the least desired specialty rooms, with 32% buyers likely to reject a potential home with this feature, and only 13% seeing it as an essential/must-have feature. Though the national decline continued, regional patterns were mixed compared to the broader declines seen in 2023. Three of the nine divisions saw a decline in 2024, including the West North Central, West South Central, and Pacific. The West North Central division reversed the notable increase seen in 2023, decreasing from 26.9% to 21.5%. Meanwhile, shares in both the West South Central and Pacific fell to their lowest levels since NAHB began tracking this data in 2017. Meanwhile, shares of two-story foyers rose in the other six divisions. New England rebounded from 17.5% to 23.2%, after declining in 2023. The Middle Atlantic continued its upward trend reaching 35.3%, the highest share since 2017. The East South Central and Mountain divisions also posted solid gains, increasing by 3.6 and 3.5 percentage points respectively. The South Atlantic and East North Central divisions saw modest increases, remaining relatively stable in 2024. Discover more from Eye On Housing Subscribe to get the latest posts sent to your email.

Two-Story Foyer Trend Stabilize in 20242025-10-27T11:17:19-05:00

Inflation Picks Up in September

2025-10-24T11:18:25-05:00

Inflation increased in September to the fastest pace since the start of the year, showing tariff pressure on prices continues to materialize gradually, according to the Bureau of Labor Statistics (BLS) latest report. This month’s data collection was completed prior to the government shutdown but was published this week in order to provide next year’s Social Security cost-of-living adjustments. Meanwhile, shelter inflation remained unchanged from last month and continued its downward trend, though it remains higher than pre-pandemic levels. Though inflation is likely to remain elevated this year, the Fed is expected to continue easing given signs of labor market weakening. The housing market’s sensitivity to interest rates suggests rate cuts could help ease the affordability crisis and support housing supply even as builders continue to face supply-side challenges. During the past twelve months, on a non-seasonally adjusted basis, the Consumer Price Index (CPI) rose by 3.0% in September, the highest reading since January 2025. Excluding the volatile food and energy components, the “core” CPI increased by 3.0% over the past twelve months. A large portion of the “core” CPI is the housing shelter index, which increased 3.6% over the year, the lowest reading since October 2021. Meanwhile, the component index of food rose by 3.1%, and the energy component index increased by 2.8%. On a monthly basis, the CPI rose by 0.3% in September (seasonally adjusted), after a 0.4% increase in August. The “core” CPI increased by 0.2% in September, after a 0.3% increase in August. The price index for a broad set of energy sources rose by 1.5% in September, as declines in natural gas (-1.2%) and electricity (-0.5%) were offset by increases in gasoline (+4.1%) and fuel oil (+0.6%). Meanwhile, the food index rose by 0.2%, after a 0.5% increase in August. The index for food away from home increased by 0.1%, and the index for food at home rose by 0.3%. The index for gasoline (+4.1%) replaced shelter as the largest contributor to the overall monthly increase in all-items index. Other top contributors that rose in September included indexes for shelter (+0.2%), airline fares (+2.7%), recreation (+0.4%), household furnishings and operations (+0.4%) as well as apparel (+0.7%). Meanwhile, the index for motor vehicle insurance (-0.4%), used cars and trucks (-0.4%) and communication (-0.2%) were among the few major indexes that decreased over the month. The index for shelter, which makes up more than 40% of the “core” CPI, rose by 0.2% in September, following a 0.4% increase last month. The index for owners’ equivalent rent (OER) rose by 0.1% and index for rent of primary residence (RPR) increased by 0.2% over the month. NAHB constructs a “real” rent index to indicate whether inflation in rents is faster or slower than core inflation. It provides insight into the supply and demand conditions for rental housing. When inflation in rents is rising faster than core inflation, the real rent index rises and vice versa. The real rent index is calculated by dividing the price index for rent by the core CPI (to exclude the volatile food and energy components). In September, the Real Rent Index remained unchanged. Over the first nine months of 2025, the average monthly growth rate remained flat at 0.0%, slower than the average of 0.1% in 2024. Discover more from Eye On Housing Subscribe to get the latest posts sent to your email.

Inflation Picks Up in September2025-10-24T11:18:25-05:00

Existing Home Sales Increase in September

2025-10-23T11:22:33-05:00

Existing home sales rose to a seven-month high in September as mortgage rates eased and inventory improved, according to the National Association of Realtors (NAR). Resale inventory matched to the highest level since May 2020, though it remained below pre-pandemic levels.  Mortgage rates hovered between 6.5% and 7% earlier this year due to ongoing economic and tariff uncertainty. However, rates recently fell below 6.5% for the first time this year as the Fed resumed rate cuts at its September meeting. Last week, the average mortgage rate decreased to a nearly one-year low of 6.27%. With additional rate cuts expected in coming months, lower mortgage rates and improved inventory should bring more buyers and sellers into the market. Total existing home sales, including single-family homes, townhomes, condominiums, and co-ops, rose 1.5% to a seasonally adjusted annual rate of 4.06 million in September. On a year-over-year basis, sales were 4.1% higher than a year ago. The existing home inventory level was 1.55 million units in September, up 1.3% from August and up 14.0% from a year ago. At the current sales rate, September unsold inventory sits at a 4.6-months’ supply, unchanged from July and August but up from 4.2-months in September 2024. Inventory between 4.5 to 6 month’s supply is generally considered a balanced market. Homes stayed on the market for a median of 33 days in September, up from 31 days last month and 28 days in September 2024. The first-time buyer share was 30% in September, up from 28% in August and 26% from a year ago. The September all-cash sales share was 30% of transactions, up from 28% in August but unchanged from a year ago. All-cash buyers are less affected by changes in interest rates. The September median sales price of all existing homes was $415,200, up 2.1% from last year. This marks the 27th consecutive month of year-over-year increases. The median condominium/co-op price in September was down 0.6% from a year ago at $360,300.  Recent gains for home inventory will put downward pressure on resale home prices in most markets in 2025. Geographically, three of the four regions saw an increase in existing home sales in September, with an increase of 5.5% in the West, 2.1% in the Northeast, and 1.6% in the South. Meanwhile, sales in the Midwest fell 2.1%. On a year-over-year basis, sales were up in the South (6.9%), Northeast (4.3%) and the Midwest (2.2%), while sales were unchanged in the West. The Pending Home Sales Index (PHSI) is a forward-looking indicator based on signed contracts. The PHSI rose from 71.8 to 74.7 in August, suggesting lower mortgage rates are bringing more buyers back into the market. On a year-over-year basis, pending sales were 3.8% higher than a year ago, according to the National Association of Realtors’ data. Discover more from Eye On Housing Subscribe to get the latest posts sent to your email.

Existing Home Sales Increase in September2025-10-23T11:22:33-05:00

Where are Porches Most Common for Newly-Built Homes?

2025-10-22T11:16:10-05:00

Although the share of new homes with porches edged down in 2024, porches continue to rank as the most common outdoor feature on new homes, according to NAHB tabulation of the latest data from the Survey of Construction (SOC, conducted by the U.S. Census Bureau with partial funding from HUD). Of the roughly 1.0 million single-family homes started in 2024, the SOC data show that 67.2% were built with porches. This is down, but only slightly, from the all-time peak of 67.7% reported a year earlier. Porches also continue to be more common on new homes than the other outdoor features covered in the SOC: patios and, especially, decks.   Traditionally, porches on new homes have been most common in the four states that make up the East South Central Census division. That was true again in 2024, although only by a narrow margin. In 2024, 81% of new homes in the East South Central had porches, but this share was well over 70% in three other divisions: the Pacific (78%), Mountain (77%), and South Atlantic (74%) divisions. Compared to the 2023 numbers reported in last year’s post, the porch percentages were up by two points in the East and West South Central divisions, unchanged in the Mountain and South Atlantic divisions, and down at least slightly in the other five divisions. Detail about the characteristics of porches on new homes is available from the Builder Practices Survey (BPS), conducted annually by Home Innovation Research Labs. Among other things, the 2025 BPS report (based on homes built in 2024) shows that porches continue to be far more common on the front of new single-family homes than on the side or rear. When on the front, porches average approximately 100 square feet of floor area. The other categories of porches distinguished in the SOC, although comparatively rare, tend to be noticeably larger: 140 square feet for a side or rear porch, and just over 200 square feet for a screened-in porch. On a square foot basis, builders continue to use concrete more than any other material to build new-home porches. Only one division remains a clear outlier in this regard. In New England, builders seldom use concrete in new-home porches, instead most often building them out of composite (a blend of usually recycled wood fibers and plastic). In that division, they also use treated wood, PVC or other plastics, cedar, and natural stone more often than concrete. Discover more from Eye On Housing Subscribe to get the latest posts sent to your email.

Where are Porches Most Common for Newly-Built Homes?2025-10-22T11:16:10-05:00

How COVID-19 Reshaped the U.S. Labor Market and Housing Demand

2025-10-22T09:19:14-05:00

Between February 2020 and June 2022, the U.S. labor market experienced the deepest downturn on record followed by the fastest recovery in at least a century. The COVID-19 pandemic disrupted every corner of the economy, forcing massive shutdowns and triggering record job losses across all industries. Yet, in just two years, the labor market rebounded with remarkable speed, marking a historic recovery that continues to reshape both employment trends and the broader economy. Overall Employment Recovery At the beginning of 2020, the U.S. economy was enjoying a “Goldilocks” moment at the end of Trump’s first term with the longest continuous stretch of job growth on record. The unemployment rate remained near a 50-year low of 3.5%, job openings were steady, and wage growth was modestly outpacing inflation. Then, the COVID-19 pandemic struck, reshaping the labor market dramatically. In April 2020 alone, the U.S. lost roughly 20.5 million jobs—an unprecedented drop since data collection began in 1939—bringing total nonfarm payroll employment to its lowest level since February 2011. By the end of that spring, the economy shed nearly 22.9 million jobs due to shutdowns and restrictions. Meanwhile, the unemployment rate soared to 14.8% in April 2020, the highest level since the Great Depression. This recession was not only the deepest in U.S. history but also the fastest to recover. It took just 26 months for overall employment to return to pre-pandemic levels—a speed unmatched by any previous downturn. In February 2020, total employment stood at 152.3 million but plunged 14.4% to 130.4 million by April. From there, the labor market rebounded relentlessly, surpassing the February 2020 level to reach 152.4 million by June 2022. Notably, May 2020 saw the largest monthly job gain on record, signaling the beginning of a historic recovery. Uneven Industrial Recoveries While the overall U.S. labor market made a remarkable recovery from the historic COVID-19 downturn, the path of recovery varied widely across industries. Among all the major industries, the leisure and hospitality sector was hit the hardest, losing approximately 8.2 million jobs—nearly half their workforce—in just two months. However, by August 2025, this sector had not only fully recovered but exceeded its pre-pandemic employment level. Other major industries that experienced significant job losses include health care and social assistance (down by nearly 2.3 million jobs), retail trade (2.27 million), and professional and business services (2.26 million). All of these sectors have not only recovered but also expanded beyond their pre-pandemic employment levels by August 2025. Government employment, although not driven by market forces and constraints, declined by about 1.46 million jobs but has rebounded to 103% of its pre-pandemic size. Construction, another vital sector, lost around 1.09 million jobs but has experienced a robust recovery, now standing at 109% of the February 2020 level. However, not all sectors have bounced back fully. Manufacturing, especially in durable goods, remains just shy of full recovery, at 99% of its pre-pandemic employment level after losing 933,000 jobs. The mining and logging sector, which lost 145,000 jobs, continues to lag, with employment still at just 89% of its February 2020 level. These industries continue to face challenges in returning to their pre-pandemic workforce size. Meanwhile, several sectors, such as private educational services, transportation and warehousing, non-durable goods manufacturing, wholesale trade, information, financial activities, and utilities, all experienced smaller job losses relative to the hardest-hit industries and have now surpassed their pre-pandemic employment levels, with transportation and warehousing showing the strongest rebound at 117% of the February 2020 level. From Job Market to Housing Market: Pandemic Reshapes Housing Market The labor market recovery has occurred alongside a broader reshaping of household behavior, particularly around how and where Americans live. As lockdowns and remote work kept people home, the share of expenditures devoted to at-home consumption rose sharply. This shift had profound effects on housing demand. In response to the COVID-19 pandemic, the Federal Reserve lowered the federal funds rate to a target range of 0% to 0.25% in March 2020 and remained at this historically low level for nearly two years to stimulate borrowing and spending to support the economy. Fueled by historically low interest rates, the housing market experienced an unprecedented surge. Sales of both new and existing single-family homes soared. New home sales peaked at more than 160% of 2019 levels by mid-2020, while existing home sales also rose sharply. However, as inflationary pressures grew, the Federal Reserve began raising rates aggressively in 2022. This tightening cycle significantly cooled the housing market, particularly for existing homes. Existing home sales fell below pre-pandemic levels and continued to trend downward through 2025. In contrast, new home sales—while volatile—generally remained above 2019 levels in the past two years. A shortage of resale inventory, coupled with homeowners hesitant to give up locked-in low mortgage rates, led many buyers to turn to new construction despite elevated interest rates. Looking Ahead: Easing Rates and a Potential Market Rebound In recent months, there have been signs of a potential rebound in the housing market. Following the Federal Reserve’s rate cut in September 2025, mortgage rates fell below 6.5% for the first time this year. As of last week, the average 30-year fixed mortgage rate had dropped to 6.27%. With additional Fed rate cuts expected in the coming quarters, lower borrowing costs and improving inventory levels could stimulate housing market activity on both the buying and selling sides of the industry. Discover more from Eye On Housing Subscribe to get the latest posts sent to your email.

How COVID-19 Reshaped the U.S. Labor Market and Housing Demand2025-10-22T09:19:14-05:00

Median Age of Construction Labor Force Holds at 42 

2025-10-21T09:15:17-05:00

The median age of construction labor force is 42, one year older than a typical worker in the national labor force, according to NAHB analysis of the most recent 2023 American Community Survey (ACS) data. However, more younger people are joining the construction industry. Despite some improvements since the peak of the skilled labor shortage in 2021, attracting skilled labor remains the primary long-term goal for the construction industry.   The median age of construction labor force varies across states. The color coding in the map below tracks the median age of people working in the construction industry.  The state with the oldest median age (46 years old) is Alaska, followed by Connecticut and Maine, where the median age of workers in construction is 45. Construction labor force is younger on average in the central part of the nation. For example, half of all people working in construction in Utah are under 39.  The second data series mapped above is the difference between the median age of workers in construction in each state and the median age of all industry workers. These estimates are reported as the numbers printed on each state. A positive number indicates that on average, people in construction are older than a typical worker in the state labor force. Alaska has the largest difference, where the median age of construction labor force is 6 years higher than the overall median in the state. On the other hand, a negative number indicates the construction labor force is, in general, younger than the state labor force. In Vermont and Delaware, the median age of workers in construction is 2 years younger than the overall median.   Analysis of the age distribution of workers in construction over time reveals that Gen Z, those born between 1997 and 2012, are more likely to enter the construction industry than Millennials, when they were the youngest generation in the labor force. They are drawn to careers in the construction industry due to factors such as new innovations in modern construction technologies, high costs of college education, competitive wages in construction, job security and potential for growth.    Generational shifts are reshaping the construction labor force. The share of Gen Z has more than doubled, increasing from 6.4% in 2019 to 14.1% in 2023, reflecting a growing pipeline of younger workers. Millennials’ share also rose from 35.7% to 37.7% over the same period. In contrast, Gen X declined from 36.6% to 33.7%, while Baby Boomers fell sharply from 20.6% to 14.2% as workers moved to retirement.  The chart below shows that, as of 2023, only about 14.1% of construction labor force were Gen Zers. Around 71% of the construction labor force were Millennials and Gen-Xers, who are considered in their prime working years, compared to 66% in overall labor force. The relative greater share of Gen X construction labor force reveals the current challenge of the labor shortage. Gen X is a smaller generational group than the Baby Boomers. The share of Baby Boomer construction labor force is 14.2%, implying that a substantial portion of the labor force will retire in the near future. Attracting more skilled labor, especially younger generations, remains the primary long-term goal for the construction industry. Discover more from Eye On Housing Subscribe to get the latest posts sent to your email.

Median Age of Construction Labor Force Holds at 42 2025-10-21T09:15:17-05:00

Hispanics Comprise Nearly One-Third of the Construction Labor Force 

2025-10-13T09:21:06-05:00

Diversifying the construction labor force remains a key priority amid persistent skilled labor shortages. According to the 2023 American Community Survey, non-Hispanic White workers still account for the majority of the construction industry at 57%. Hispanic workers now represent nearly one-third of the labor force at 32%, followed by non-Hispanic Black workers at 5% and non-Hispanic Asian workers at 1.8%.  The most notable trend in construction labor force has been the steady rise of Hispanic participation. Between 2010 and 2023, the number of Hispanic workers in construction increased from 2.5 million to almost 3.8 million. Over the same period, their share of the labor force climbed from 23.6% to 32%, meaning that nearly one in three construction workers today is Hispanic.  Hispanics workers comprise a larger share in the construction than the broader economy, making up 31.9% of the construction labor force compared with 19.2 % across all industries. Non-Hispanic White workers account for 57.5% of the construction labor force, about the same as their share across all industries at 58.3%. Black and Asian workers, by contrast, remain underrepresented in construction. The share of Hispanic workers varies widely across states. In Maine, only 1% of workers in construction are Hispanic, while in New Mexico, Texas, California, and Nevada, more than half the construction labor force is Hispanic. Overall, Hispanic construction workers are most concentrated in the South and West, where Hispanic populations are larger. Just three states—Texas with 803,000 workers, California with 772,000, and Florida with 374,000—together employ 52% of the nation’s Hispanic construction labor force. New Mexico leads in proportional terms, with 64% of its construction labor force identifying as Hispanic, followed by Texas at 61% and California at 59%.  In the Northeast, the construction industry remains dominated by non-Hispanic White workers. In New Hampshire, Vermont, and Maine, they account for more than 90% of the labor force. Non-Hispanic Black workers make up only 5% of construction labor force nationwide, compared with nearly 12% across all industries, though their shares are much higher in Mississippi at 18%, Louisiana at 17%, and Maryland at 14%. Non-Hispanic Asian workers account for less than 2% of the construction labor force overall, though they are a significant presence in Hawaii, where they comprise 29% of construction labor force. Discover more from Eye On Housing Subscribe to get the latest posts sent to your email.

Hispanics Comprise Nearly One-Third of the Construction Labor Force 2025-10-13T09:21:06-05:00

About My Work

Phasellus non ante ac dui sagittis volutpat. Curabitur a quam nisl. Nam est elit, congue et quam id, laoreet consequat erat. Aenean porta placerat efficitur. Vestibulum et dictum massa, ac finibus turpis.

Recent Works

Recent Posts