Builders Stay Cautious as Single-Family Permits Weaken
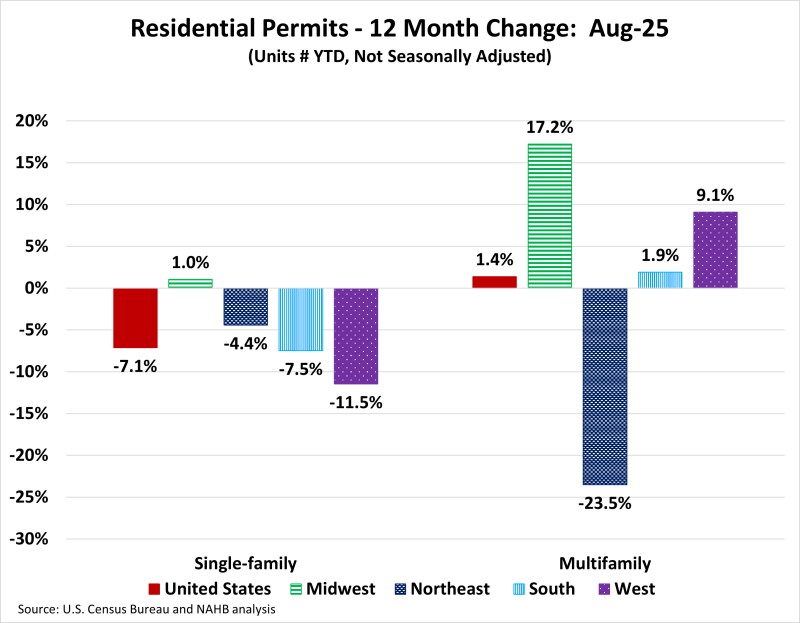
Web Master2025-10-15T08:16:46-05:00In August, single-family permit activity softened, reflecting caution among developers amid persistent economic headwinds. This trend has been consistent for eight continuous months. On the multifamily front, permitting also cooled in August but remains in the positive territory. While single-family continues to bear the brunt of affordability headwinds, the multifamily space is showing tentative signs of rebalancing. Over the first eight months of 2025, the total number of single-family permits issued year-to-date (YTD) nationwide reached 637,096. On a year-over-year (YoY) basis, this is a decline of 7.1% over the August 2024 level of 685,923. For multifamily, the total number of permits issued nationwide reached 330,617. This is 1.4% higher compared to the August 2024 level of 326,080. HBGI analysis indicates that this growth for multifamily development has been concentrated in lower density areas and among smaller builders. Year-to-date ending in August, single-family permits were up in one out of the four regions. The Midwest posted a minor increase of 1.0%. The Northeast was 4.4% lower, the South was down by 7.5%, and the West was down by 11.5% in single-family permits during this time. For multifamily permits, three out of the four regions posted increases. The Midwest was up by 17.2%, the West was up by 9.1%, and the South was up by 1.9%, Meanwhile, the Northeast declined steeply by 23.5%, driven by the New York-Newark-Jersey City, NY-NJ MSA which declined by 34.0%. Between August 2025 YTD and August 2024 YTD, 12 states posted an increase in single-family permits. The range of increases spanned 21.2% in Hawaii to 2.5% in Indiana. The remaining 38 states and the District of Columbia reported declines in single-family permits with New Mexico reporting the steepest decline of 35.1%. The ten states issuing the highest number of single-family permits combined accounted for 62.5% of the total single-family permits issued. Texas, the state with the highest number of single-family permits, issued 101,850 permits over the first eight months of 2025; this is a decline of 8.2% compared to the same period last year. The second highest state, Florida, decreased by 11.7%, while the third highest, North Carolina, posted a decline of 3.9%. Between August 2025 YTD and August 2024 YTD, 31 states and the District of Columbia recorded growth in multifamily permits, while 19 states recorded a decline. Mississippi (+113.2%) led the way with a sharp rise in multifamily permits from 250 to 533, while Maryland had the largest decline of 45.8% from 4,383 to 2,374. The ten states issuing the highest number of multifamily permits combined accounted for 60.0% of the multifamily permits issued. Over the first eight months of 2025, Florida, the state with the highest number of multifamily permits issued, experienced an increase of 20.0%. Texas, the second-highest state in multifamily permits, saw an increase of 1.5%. California, the third largest multifamily issuing state, increased by 10.1%. At the local level, below are the top ten metro areas that issued the highest number of single-family permits. For multifamily permits, below are the top ten local areas that issued the highest number of permits. Discover more from Eye On Housing Subscribe to get the latest posts sent to your email.