Fed Decision: Shifting Expectations toward Future Rate Cuts

2024-01-31T15:15:32-06:00

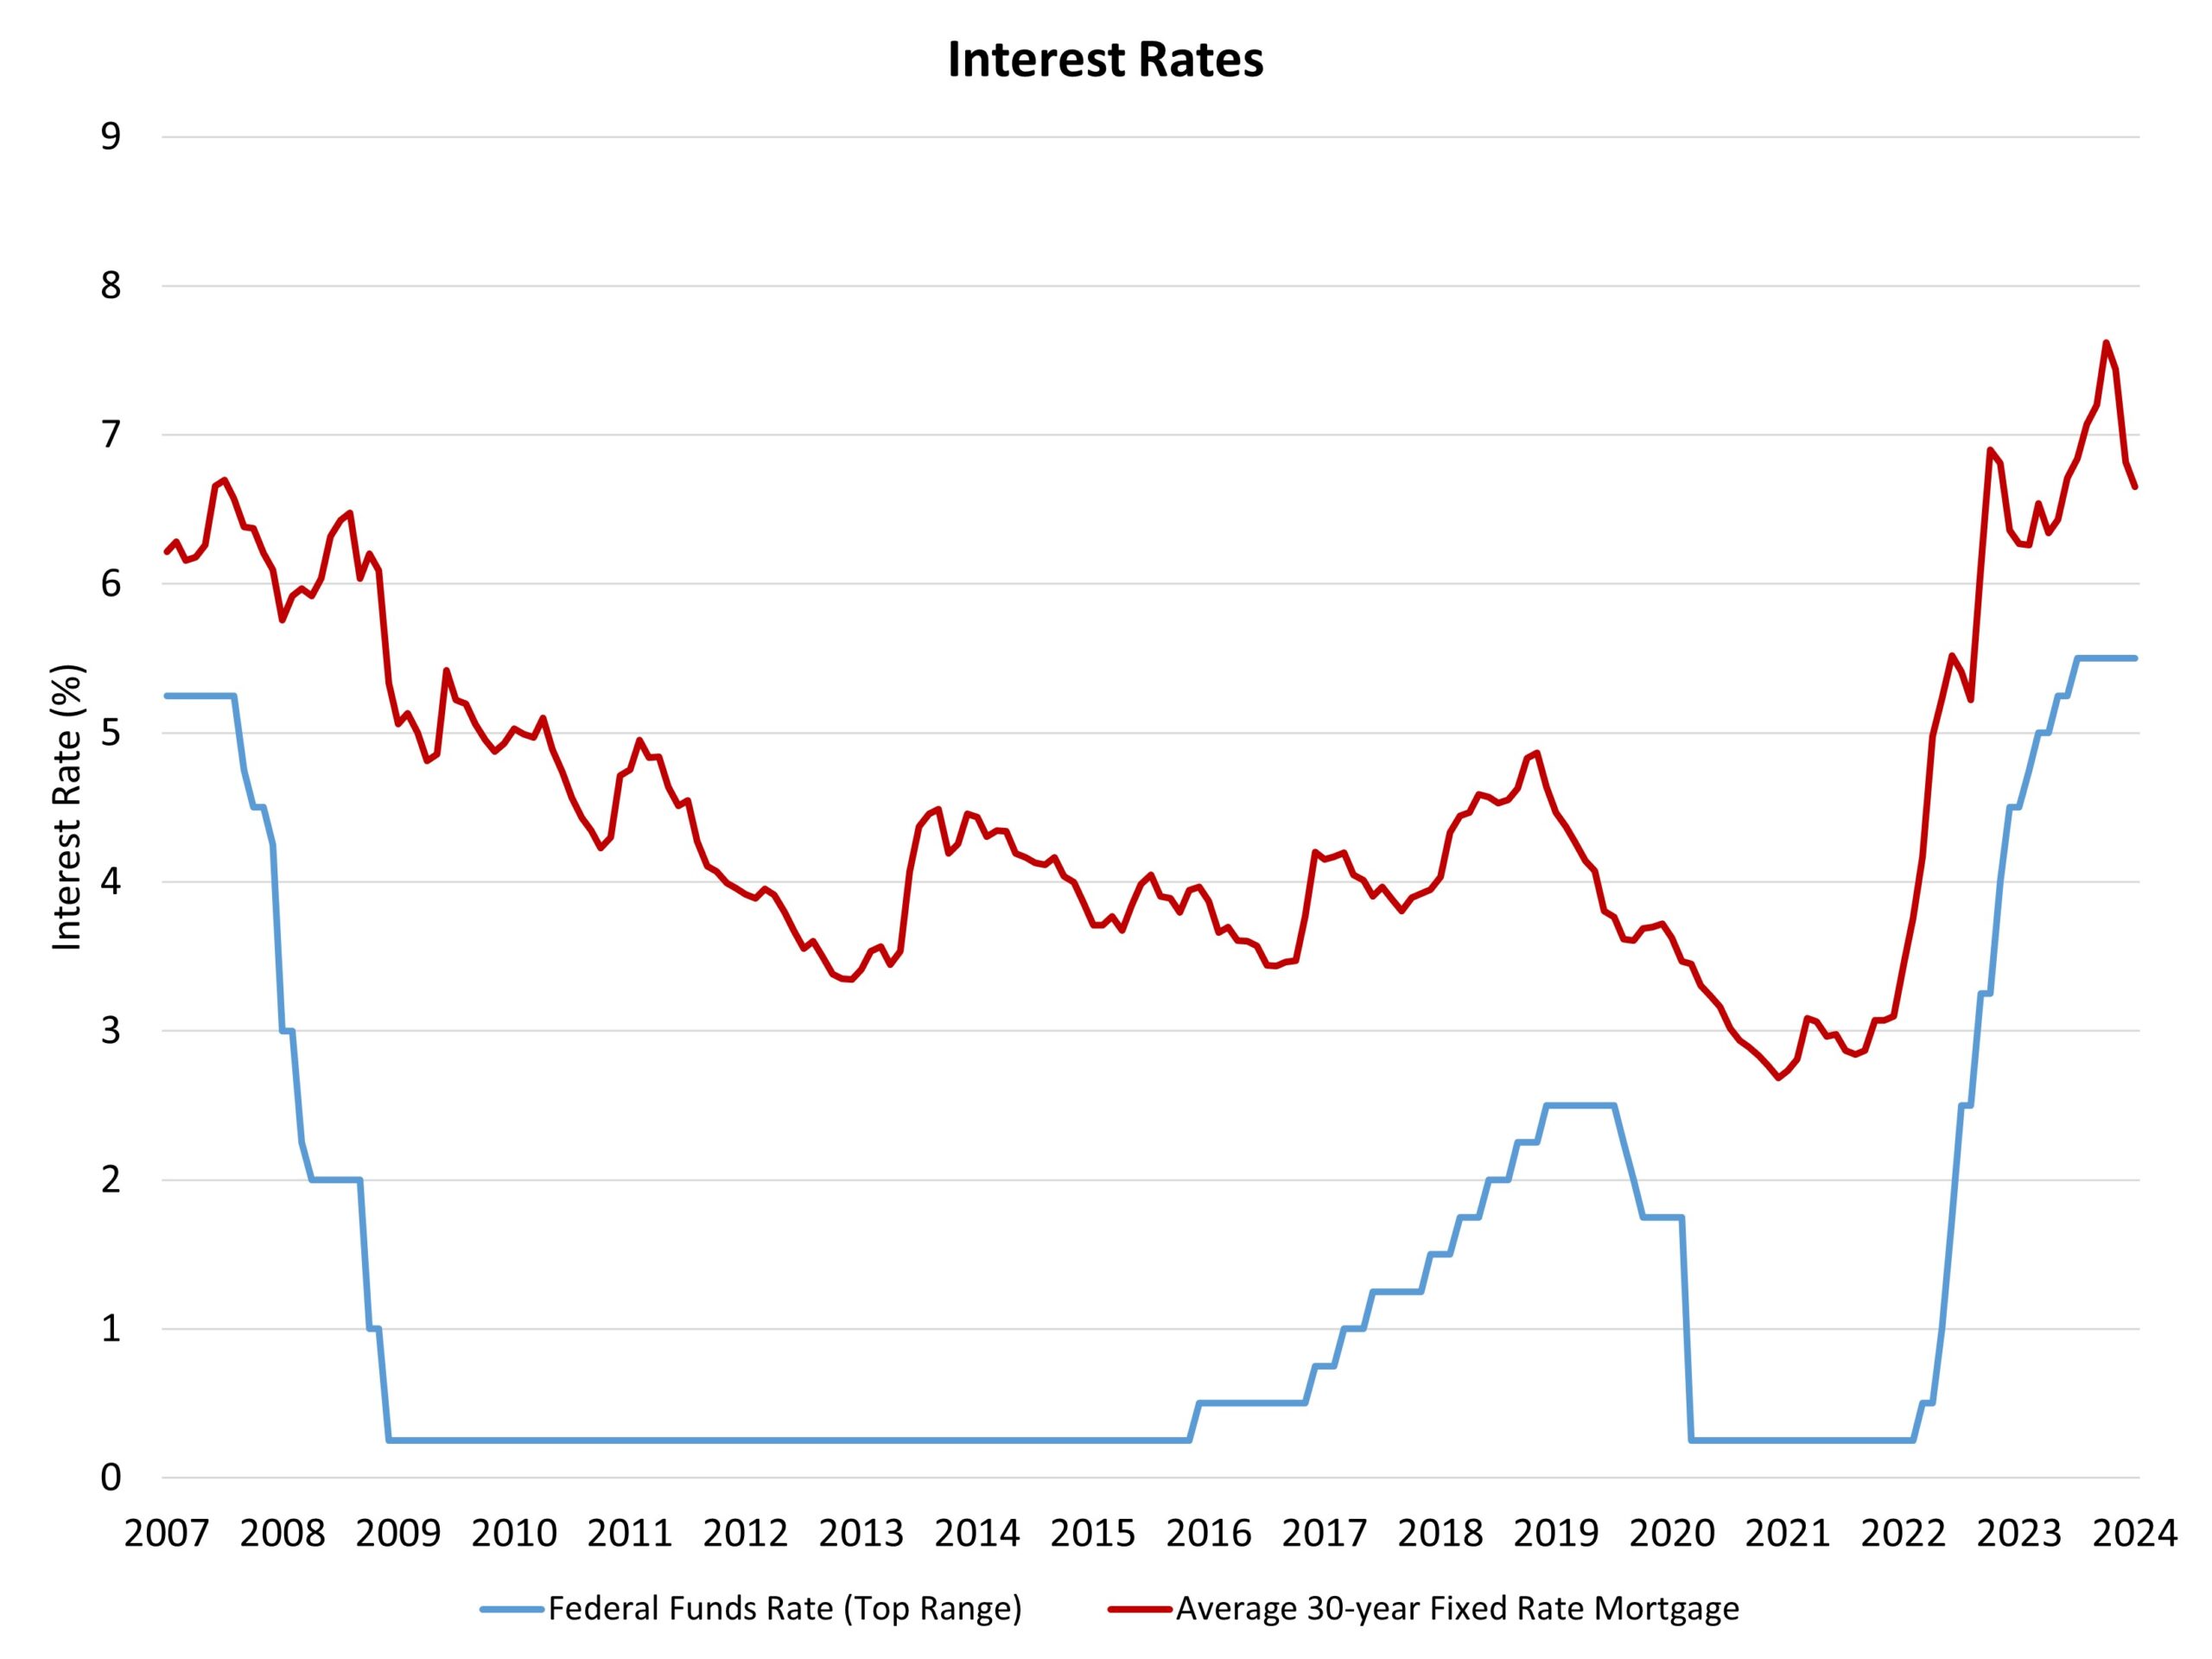
The Federal Reserve’s monetary policy committee held the federal funds rate constant at a top target of 5.5% at the conclusion of its January meeting. The Fed will continue to reduce its balance sheet holdings of Treasuries and mortgage-backed securities as part of quantitative tightening and balance sheet normalization. Marking a fourth consecutive meeting holding the federal funds rate constant, the Fed is now setting the ground for rate cuts later in 2024. With inflation data moderating (although still elevated) and limited slowing of labor market conditions, markets and some analysts are expecting a federal funds rate cut as soon as March. In contrast, NAHB’s forecast includes rate cuts beginning no earlier than June due to ongoing strong economic conditions. Today’s decision does not alter this outlook. The January Fed statement suggests the central bank is now in a holding pattern, with crosswinds between six months of declines for inflation rates but still present solid economic conditions. Recent indicators suggest that economic activity has been expanding at a solid pace. Job gains have moderated since early last year but remain strong, and the unemployment rate has remained low. Inflation has eased over the past year but remains elevated. Ongoing, current elevated rates will continue to place downward pressure on inflation as the economy progresses to the Fed’s target of 2% over the course of 2024 and 2025. However, as inflation comes down, nominal interest rates can be reduced in order to maintain constant yet still restrictive monetary policy. With an eye toward future Federal Reserve policy action, the Fed appears to be set for rate cuts later in 2024, but the commentary below suggest that the first cut will not come in March due to solid employment conditions and a low unemployment rate.   The Committee judges that the risks to achieving its employment and inflation goals are moving into better balance.   As we have noted with prior Fed announcements, the central bank missed an opportunity in its statement to cite the outsized role shelter inflation has played in recent CPI reports. Chair Powell did note that activity in the housing market was “subdued” during his opening statement at today’s press conference. He also indicated that he expects slower rent growth will, eventually, help the overall inflation picture. However, the high cost of development and home construction is slowing the fight against inflation by keeping residential supply constrained. State and local governments could assist the fight against inflation by addressing the root causes of these rising costs. Looking forward, the Fed’s prior December economic projections suggest three rate cuts in 2024. While the federal funds rate will move lower later this year, the Fed will continue reducing its balance sheet, thereby maintaining an elevated spread between the 10-year Treasury rate and rates for 30-year fixed rate mortgages. The 10-year Treasury rate, which partially determines mortgage rates, dipped below 4% after today’s Fed announcement. Mortgage rates will continue to register in the high 6% range, but below the 8% level housing markets experienced last October. Mortgage rates should move lower as 2024 progresses. ‹ Homeownership Rate Dips to 65.7% Amid Housing Affordability WoesTags: economics, FOMC, home building, housing

Fed Decision: Shifting Expectations toward Future Rate Cuts2024-01-31T15:15:32-06:00

Homeownership Rate Dips to 65.7% Amid Housing Affordability Woes

2024-01-30T12:22:31-06:00

By Na Zhao on January 30, 2024 • The Census Bureau’s Housing Vacancy Survey (CPS/HVS) reported the U.S. homeownership rate declined to 65.7% in the last quarter of 2023, amid persistently tight housing supply and elevated mortgage interest rates. This is 0.3 percentage points lower from the third quarter reading (66%). Compared to the peak of 69.2% in 2004, the homeownership rate is 3.5 percentage points lower and remains below the 25-year average rate of 66.4% amid a multidecade low for housing affordability conditions. The homeownership rate for householders aged less than 35 decreased to 38.1% in the fourth quarter of 2023, as affordability is declining for first-time homebuyers amidst elevated mortgage interest rates and tight housing supply. This age group, particularly sensitive to mortgage rates and the inventory of entry-level homes, saw the largest decline among all age categories. The national rental vacancy rate stayed at 6.6%, and the homeowner vacancy rate inched up to 0.9% from 0.8%. The homeowner vacancy rate is still hovering near the lowest rate in the survey’s 67-year history (0.7%). The homeownership rates of adults in all age groups decreased over the last year, except those aged 55-64 and 65 years and over. The homeownership rates among householders aged less than 35 experienced a 0.6 percentage point decrease, from 38.7% to 38.1%, followed by the 45-54 age group with a 0.3 percentage point decrease from 70.6% to 70.3%. Next, were households aged 35-44, who experienced a modest 0.2 percentage point decline. However, homeownership rates of householders aged 55-64 showed an increase of 0.3 percentage points. The housing stock-based HVS revealed that the count of total households increased to 131.2 million in the fourth quarter of 2023 from 129.7 million a year ago. The gains are largely due to modest gains in owner household formation (772,000 increase), while renter households increased 694,000. ‹ Little Change for Number of Open Construction Jobs

Homeownership Rate Dips to 65.7% Amid Housing Affordability Woes2024-01-30T12:22:31-06:00

Little Change for Number of Open Construction Jobs

2024-01-30T10:27:37-06:00

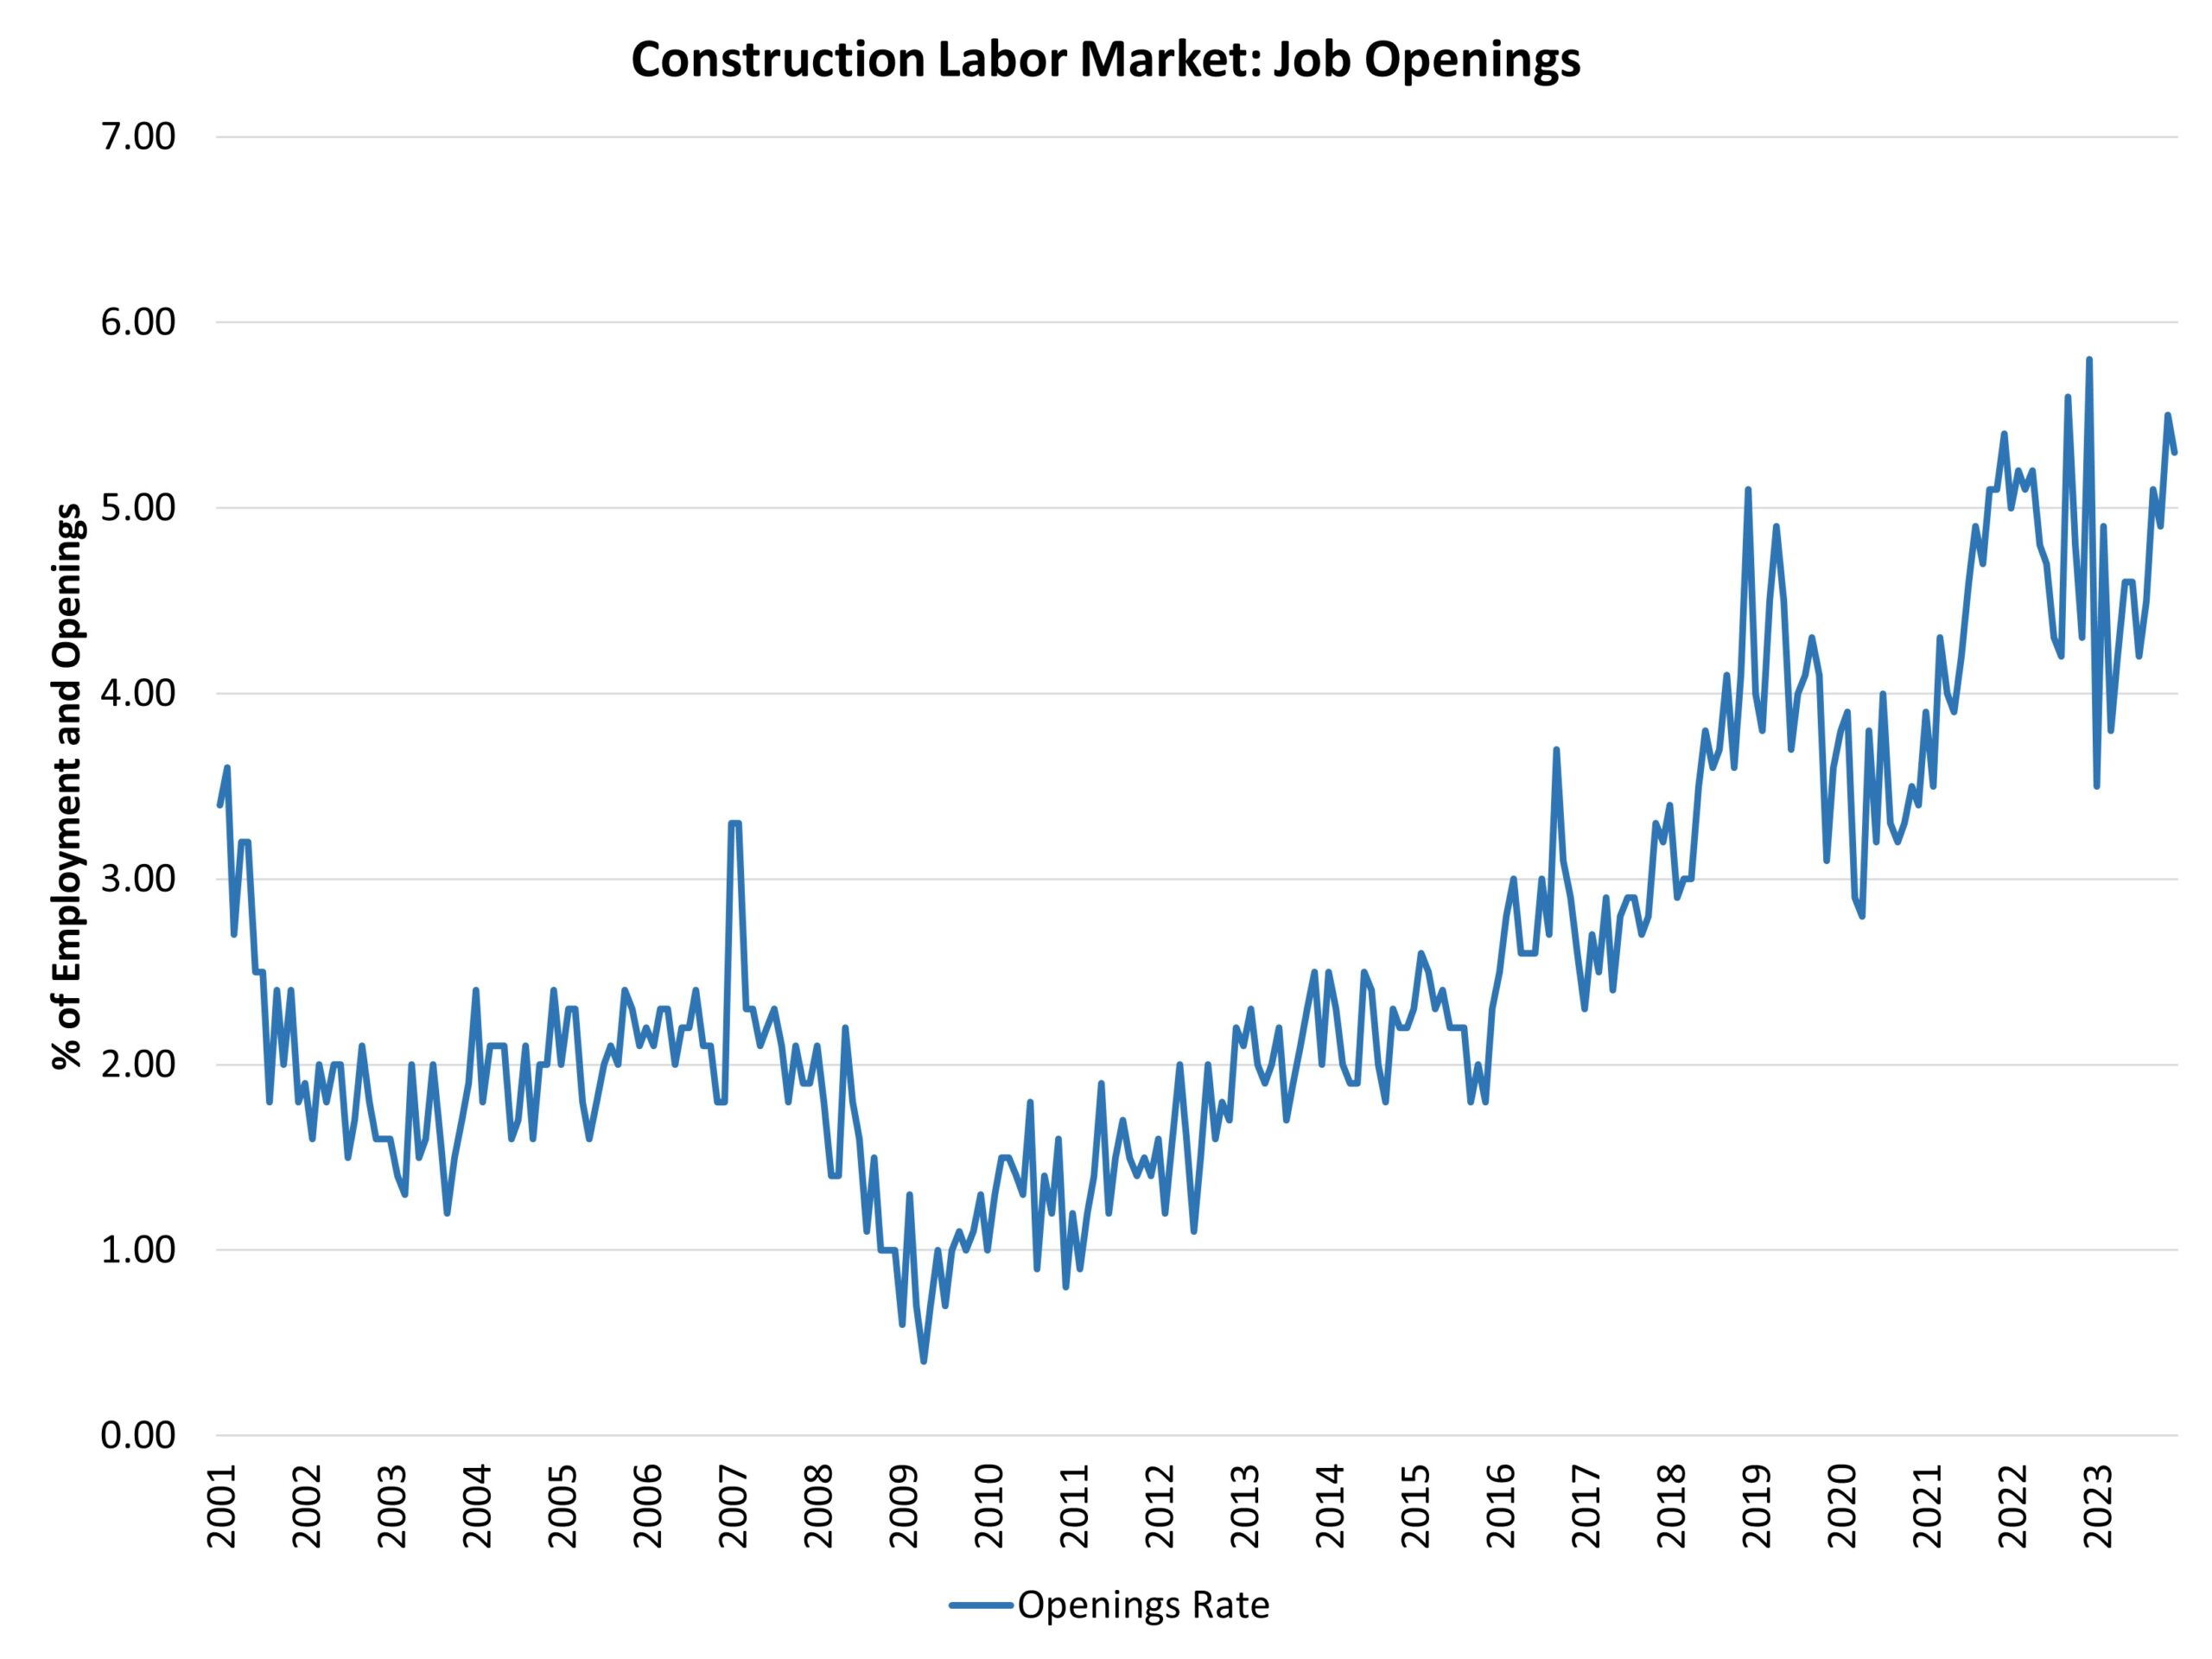
Due to tightened monetary policy, the count of total job openings for the entire economy has trended lower in recent months. This is consistent with a cooling economy that is a positive sign for future inflation readings. However, the December data showed an uptick due to stronger than expected GDP growth for the fourth quarter of 2023. In December, the number of open jobs for the economy increased to 9.0 million. This is notably lower than the 11.2 million reported a year ago. NAHB estimates indicate that this number must fall back below 8 million for the Federal Reserve to feel more comfortable about labor market conditions and their potential impacts on inflation. While the Fed intends for higher interest rates to have an impact on the demand-side of the economy, the ultimate solution for the labor shortage will not be found by slowing worker demand, but by recruiting, training and retaining skilled workers. This is where the risk of a monetary policy mistake had some risk of arising. Good news for the labor market does not automatically imply bad news for inflation. The number of open construction sector jobs was relatively unchanged in the most recent data, declining from 470,000 in November to 449,000 in December. The count was 488,000 a year ago, during an outlier month of strong data. The construction job openings rate decreased slightly to 5.3% in December. The recent, increasing trend indicates an ongoing skilled labor shortage for the construction sector. The housing market remains underbuilt and requires additional labor, lots, and lumber and building materials to add inventory. Hiring in the construction sector increased to a 4.6% rate in December after 4.5% in November. The post-virus peak rate of hiring occurred in May 2020 (10.4%) as a post-covid rebound took hold in home building and remodeling. Construction sector layoffs were steady at a 2.1% rate in December after 2.1% in November. In April 2020, the layoff rate was 10.8%. Since that time, the sector layoff rate has been below 3%, with the exception of February 2021 due to weather effects and March 2023 due to some market churn. Looking forward, attracting skilled labor will remain a key objective for construction firms in the coming years. While a slowing housing market will take some pressure off tight labor markets, the long-term labor challenge will persist beyond the ongoing macro slowdown. ‹ All-Cash Share of New Home Sales Remains Elevated in 2023Tags: economics, home building, housing, JOLTS

Little Change for Number of Open Construction Jobs2024-01-30T10:27:37-06:00

Housing Share of GDP Inched up In the Fourth Quarter of 2023

2024-01-25T12:15:13-06:00

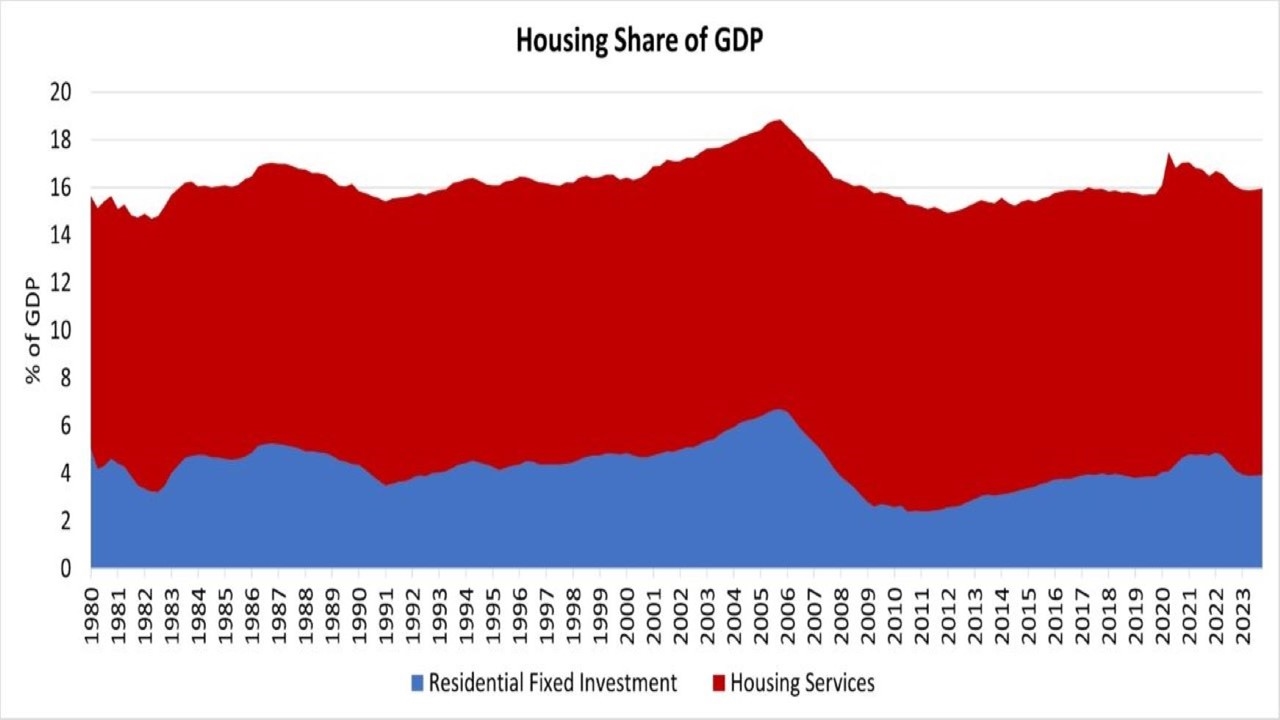
Housing’s share of the economy rose to 16.0% at the end of the fourth quarter of 2023. Overall GDP increased at a 3.3% annual rate, following a 4.9% increase in the third quarter of 2023, and a 2.1% increase in the second quarter of 2023. The annual GDP growth in 2023 was reported at 2.5%. Housing’s share of GDP on an annual basis in 2023 was 15.9% — the lowest level since 2019 (15.7%). This marks a decrease from the 2022 housing GPD share of 16.4%. In the fourth quarter, the more cyclical home building and remodeling component – residential fixed investment (RFI) – remained level at 3.9% of GDP. RFI added 4 basis points to the headline GDP growth rate in the fourth quarter of 2023, marking two consecutive quarters of positive contributions. For the year, RFI subtracted 49 basis points from GDP growth. Housing services added 5 basis points to GDP growth in the fourth quarter. Moreover, housing services added 5 basis points to annual GDP growth. Housing-related activities contribute to GDP in two basic ways: The first is through residential fixed investment (RFI). RFI is effectively the measure of home building, multifamily development, and remodeling contributions to GDP. It includes construction of new single-family and multifamily structures, residential remodeling, production of manufactured homes and brokers’ fees. For the fourth quarter, RFI was 3.9% of the economy, recording a $1.1 trillion seasonally adjusted annual pace. RFI constituted 3.9% of GDP at $1.1 trillion for the year as well. The second impact of housing on GDP is the measure of housing services, which includes gross rents (including utilities) paid by renters, and owners’ imputed rent (an estimate of how much it would cost to rent owner-occupied units), and utility payments. The inclusion of owners’ imputed rent is necessary from a national income accounting approach, because without this measure, increases in homeownership would result in declines in GDP. For the fourth quarter, housing services represented 12.0% of the economy or $3.4 trillion on a seasonally adjusted annual basis. For 2023, housing services accounted for 11.9% of GDP at $3.3 trillion over the year. Taken together, housing’s share of GDP was 16.0% for the fourth quarter. Historically, RFI has averaged roughly 5% of GDP while housing services have averaged between 12% and 13%, for a combined 17% to 18% of GDP. These shares tend to vary over the business cycle. However, the housing share of GDP lagged during the post-Great Recession period due to underbuilding, particularly for the single-family sector. ‹ U.S. Economy Ends 2023 With Surprisingly Strong GrowthTags: homebuilding, housing, housing share of GDP, housing share of the economy

Housing Share of GDP Inched up In the Fourth Quarter of 20232024-01-25T12:15:13-06:00

U.S. Economy Ends 2023 With Surprisingly Strong Growth

2024-01-25T12:15:53-06:00

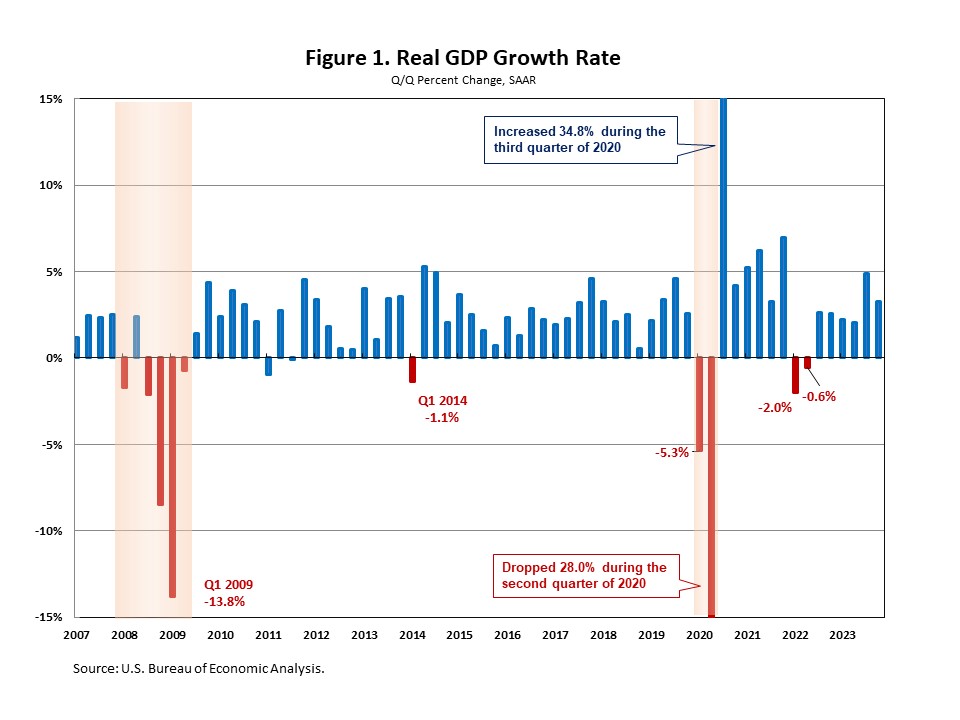
The U.S. economy grew at a surprisingly strong pace in the fourth quarter, mainly fueled by resilient consumer spending. However, the fourth quarter data from the GDP report suggests that inflation is cooling. The GDP price index rose 1.5% for the fourth quarter, down from a 3.3% increase in the third quarter. The Personal Consumption Expenditures (PCE) Price Index, which measures inflation (or deflation) across various consumer expenses and reflects changes in consumer behavior, rose 1.7% in the fourth quarter, down from a 2.6% increase in the third quarter. According to the “advance” estimate released by the Bureau of Economic Analysis (BEA), real gross domestic product (GDP) increased at an annual rate of 3.3% in the fourth quarter of 2023, following a 4.9% gain in the third quarter. It marks the sixth consecutive quarter of growth. This quarter’s growth was higher than NAHB’s forecast of a 0.9% increase. For the full year, real GDP increased 2.5% in 2023, up from a 1.9% increase in 2022, and slightly better than NAHB’s forecast of 2.4%. This quarter’s increase in real GDP reflected increases in consumer spending, exports, government spending, and private domestic investment. Imports, which are a subtraction in the calculation of GDP, increased 1.9%. Consumer spending, the backbone of the U.S. economy, rose at an annual rate of 2.8% in the fourth quarter, reflecting increases in both services and goods. While expenditures on services increased 2.4% at an annual rate, goods spending increased 3.8% at an annual rate, led by other nondurable goods (+5.1%) and recreational goods and vehicles (+10.9%). Both federal government spending and state and local government spending increased in the fourth quarter. The increase in state and local government spending primarily reflected increases in compensation of state and local government employees and investment in structures, while the increase in federal government spending was led by nondefense spending. In the fourth quarter, exports rose 6.3%, reflecting increases in both goods and services. Nonresidential fixed investment increased 1.9% in the fourth quarter, following a 1.4% increase in the third quarter. The increase in nonresidential fixed investment reflected increases in intellectual property products (2.1%), structures (3.2%), and equipment (1.0%). Additionally, residential fixed investment (RFI) rose 1.1% in the fourth quarter, down from a 6.7% increase in the third quarter. This is the second straight gain after nine consecutive quarters of declines. Within residential fixed investment, single-family structures rose 11.6% at an annual rate, multifamily structures declined 1.0%, and improvements rose 5.5%. ‹ New Home Sales Bounce Back in December on Lower Mortgage RatesHousing Share of GDP Inched up In the Fourth Quarter of 2023 ›Tags: economics, gdp, inflation, macroeconomics, macroeconomy, residential fixed investment

U.S. Economy Ends 2023 With Surprisingly Strong Growth2024-01-25T12:15:53-06:00

Builders’ Top Challenges for 2024

2024-01-24T12:17:19-06:00

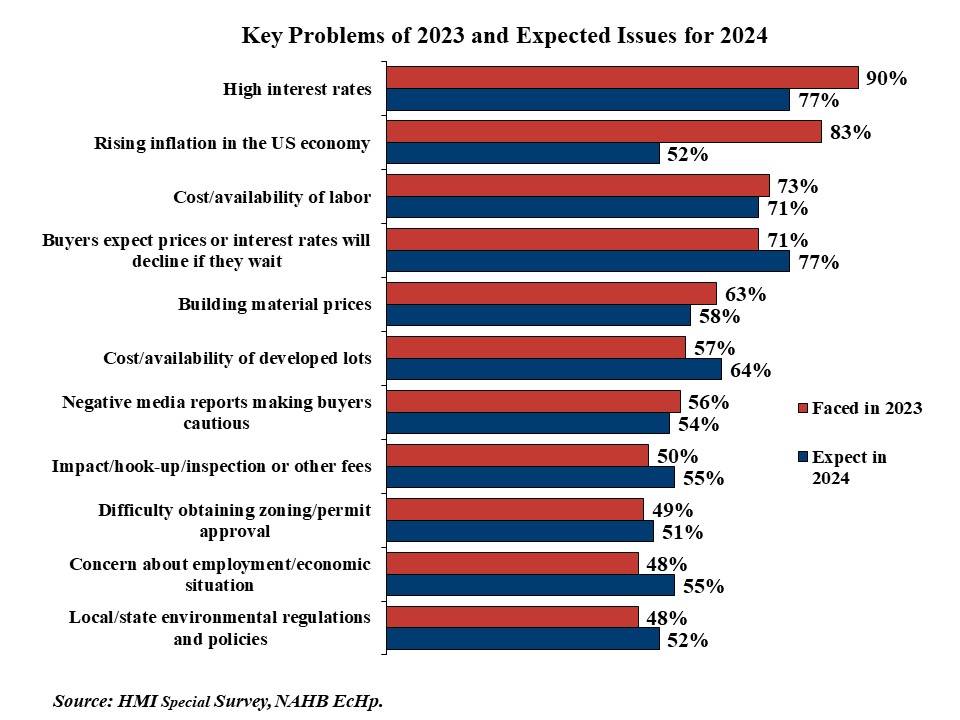
According to the January 2024 survey for the NAHB/Wells Fargo Housing Market Index, high interest rates were a significant issue for 90% of builders in 2023, and 77% expect them to be a problem in 2024. The second most widespread problem in 2023 was rising inflation in US Economy, cited by 83% of builders, with 52% expecting it to be a problem in 2024. The cost and availability of labor was a significant problem to only 13% of builders in 2011. That share has increased significantly over the years, peaking at 87% in 2019.  Due to the pandemic, fewer builders reported this problem in 2020 (65%), but the share rose again in 2021 (82%) and 2022 (85%).  Not surprisingly, given the increase in construction job openings, the share eased slightly in 2023 to 74%.  A similar 75% expect the cost and availability of labor to remain a significant issue in 2024.In 2011, building materials prices was a significant problem to 33% of builders.  The share has fluctuated over the years, from a low of 42% in 2015 to a peak of 96% in 2020, 2021, and 2022.  The slowdown in single-family construction in 2023 made this less of a problem for builders last year, as ‘only’ 63% reported it as a significant issue.  Fewer expect it to face it in 2024 (58%). Compared to the supply-side problems of materials and labor, problems attracting buyers have not been as widespread, but builders expect many of them to become more of a problem in 2024. Buyers expecting prices or interest rates to decline if they wait was a significant problem for 71% of builders in 2023, with 77% expecting it to be an issue in 2024.  Negative media reports making buyers cautious was reported as a significant issue by 56% of builders in 2023, and 54% expect this problem in 2024. Concern about employment/economic situation was another buyer issue for 48% of builders in 2023, but 55% anticipate this issue in 2024. Gridlock/uncertainty in Washington making buyers cautious was a significant problem for 42% of builders in 2023, but a larger 54% expect it to be a problem in 2024.  Less than 30% of builders experienced problems in 2023 with buyers being unable to sell existing homes, potential buyers putting off purchase due to student debt, and competition from distressed sales/foreclosures. For additional details, including a complete history for each reported and expected problem listed in the survey, please consult the full survey report. ‹ Employment Situation in December: State-Level AnalysisTags: builders, Building Materials, construction, hmi, home building, housing trends report, inflation, interest rates, labor, single-family

Builders’ Top Challenges for 20242024-01-24T12:17:19-06:00

Employment Situation in December: State-Level Analysis

2024-01-23T12:24:22-06:00

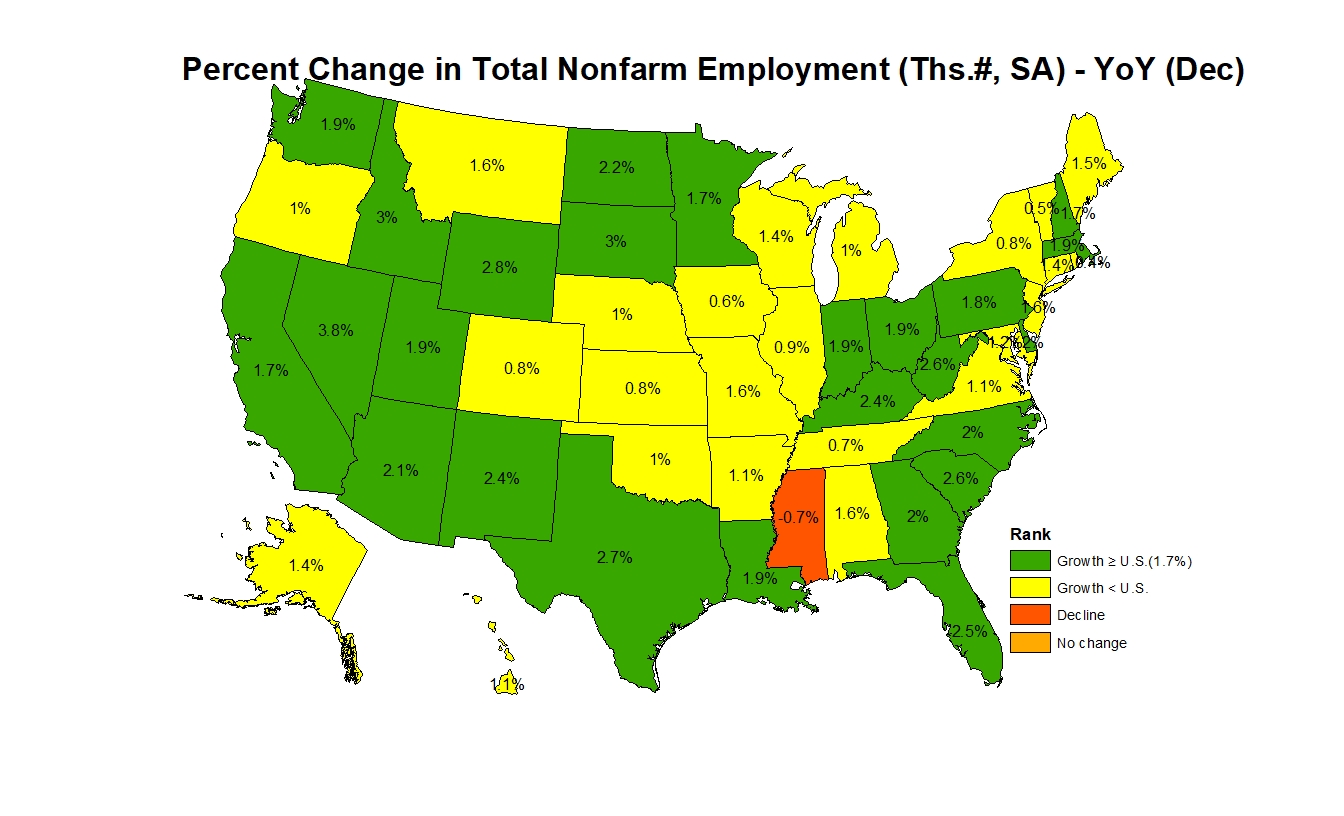
Nonfarm payroll employment increased in 39 states and the District of Columbia in December compared to the previous month, while 11 states saw a decrease. According to the Bureau of Labor Statistics, nationwide total nonfarm payroll employment increased by 216,000 in December, following a gain of 173,000 jobs in November. On a month-over-month basis, employment data was most favorable in California, which added 23,400 jobs, followed by Texas (+19,100), and then Florida (+16,500). A total of 28,700 jobs were lost across thirteen states, with Virginia reporting the steepest job losses at 11,800.  In percentage terms, employment in Alaska increased the highest at 0.5%, while Vermont saw the biggest decline at 0.6% between November and December. Year-over-year ending in December, 2.7 million jobs have been added to the labor market. Except for Mississippi, all other states and the District of Columbia added jobs compared to a year ago. The range of job gains spanned from 1,400 jobs in Vermont to 369,600 jobs in Texas.  Conversely, Mississippi lost 7,800 jobs on a year-over-year basis. In percentage terms, Nevada reported the highest increase at 3.8%, while Mississippi showed the largest decrease at 0.7% compared to a year ago. Across the nation, construction sector jobs data[1]—which includes both residential and non-residential construction— showed that 32 states reported an increase in December compared to November, while 16 states and the District of Columbia lost construction sector jobs. The remaining two, Alaska and Indiana reported no change on a month-over-month basis. New Jersey, with the highest increase, added 3,800 construction jobs, while Ohio, on the other end of the spectrum, lost 4,100 jobs. Overall, the construction industry added a net 17,000 jobs in December compared to the previous month. In percentage terms, South Dakota reported the highest increase at 4.1% and the District of Columbia reported the largest decline at 1.9%. Year-over-year, construction sector jobs in the U.S. increased by 197,000, which is a 2.5% increase compared to the December 2022 level. Texas added 32,800 jobs, which was the largest gain of any state, while New York lost 15,600 construction sector jobs. In percentage terms, South Dakota had the highest annual growth rate in the construction sector at 20.8%. Over this period, New York reported the largest decline of 3.9%. [1] For this analysis, BLS combined employment totals for mining, logging, and construction are treated as construction employment for the District of Columbia, Delaware, and Hawaii. ‹ U.S. Population Growth Returns to Pre-Pandemic LevelsTags: construction labor, economics, state and local markets, state employment

Employment Situation in December: State-Level Analysis2024-01-23T12:24:22-06:00

Why You Need a Home Inventory

2024-01-23T01:16:40-06:00

You’ve bought insurance for a worst-case scenario. But having insurance is just one step. Taking an inventory of your possessions is another. Why? In case of theft, loss, or damage due to fire or a weather-related event, you’ll know what to claim—plus, it can prevent a delay in your claim. Here are some questions to consider when creating a record of your home inventory: What Will Your System Be? Besides deciding what you would want to be replaced, figure out what process for cataloging works best for you. For example, you can make a spreadsheet or take videos and pictures using your smartphone. Check with your insurance company; they may have an app or online form available. Where Should You Start? Don’t let yourself get overwhelmed. Organize your inventory by room. Start with a small closet or the kitchen. Also, make it a habit. When you get something new or get rid of something, update your inventory. What Should You Include? Ask your insurance agent what documentation will be needed to make a claim. You may need to add receipts, purchase contracts, basic descriptions, serial numbers, make and model, and estimated cost in your records. How Can You Keep the Inventory List Safe? Store your inventory in a fireproof safe, an external drive, or an online storage account. Be sure it is a place that is easily accessible. Hopefully, you won’t have an emergency that requires you to file a claim. But if you do, you’ll appreciate that you are prepared.

Why You Need a Home Inventory2024-01-23T01:16:40-06:00

U.S. Population Growth Returns to Pre-Pandemic Levels

2024-01-22T08:19:39-06:00

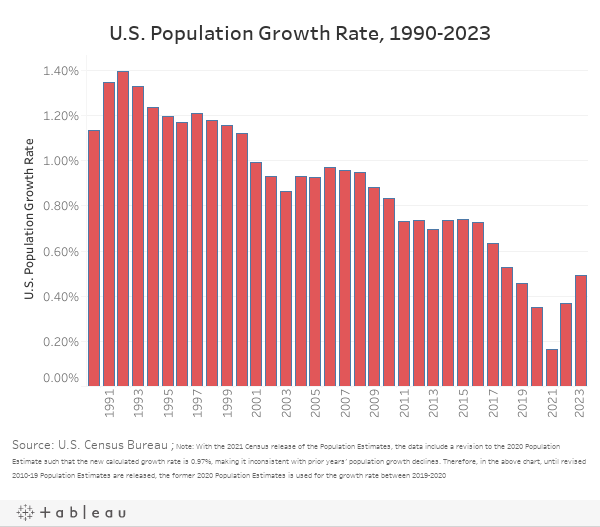
According to the U.S. Census Bureau’s latest estimates, the U.S. resident population grew by 1,643,484 to a total population of 334,914,895. The population growth rate reached its highest level since the pandemic at 0.49%. This is just above the 2019 growth rate (0.46%), while slightly below the 2018 growth rate (0.53%). The Census Bureau reports that the primary source for the increase in population growth was net international migration, as migration levels returned to pre-pandemic levels. Total net international migration has been approximately one million for the past two years, as net international migration levels were at 999,267 in 2022 and at 1,138,989 in 2023. These consecutive high levels of increase suggest international migration trends are returning to normal. The other driver of the U.S. population growth rate was positive natural births (births minus deaths), which increased the total population by 504,495. The level of positive natural births in 2023 was 126% higher than 2022 largely due to the 8.9% drop in the number of deaths in 2023. There was also a decline in the number of births of 0.7%. Regionally, the Northeast region was the only region to lose population, declining 0.08%. The South region led in population growth at 1.11% while the Midwest population grew 0.18% and the West grew 0.17%. At the State level, 42 States and D.C. had a population increase over the year, the highest number since the start of the pandemic. South Carolina led the way with population growth at 1.71%. Florida was a close second, growing 1.64%, followed by Texas at 1.58%. Numerically, four States’ populations have increased by over 100,000. Texas experienced a 473,453 increase in population, Florida increased by 365,205, North Carolina increased by 139,526, and lastly Georgia increased by 111,077 persons. For the third straight year, New York’s population declined at the fastest rate of all 50 states at 0.52%. This was followed by Louisiana with a decline of 0.31%, and a decline in Hawaii of 0.30%. New York also had the highest numeric decline of 101,984 followed by California with a decline of 75,423. Eight states lost population according to Census estimates. Despite three consecutive years of population decline, California remained the most populous state by a healthy margin. California’s population was at 39,040,616 while the next most populous state was Texas at 30,503,301. The next three most populous states were Florida (22,610,726), New York (19,571,216), and Pennsylvania (12,961,683) to round out the top five States by total population. The linked table here shows the population in thousands for each state in 2021, 2022, and 2023 and the percentage change for each respective year. ‹ Existing Home Sales End 2023 at the Lowest Level Since 1995Tags: census bureau, demographics, Florida, population, Texas

U.S. Population Growth Returns to Pre-Pandemic Levels2024-01-22T08:19:39-06:00

Pandemic Silver Lining: Young Adults Moving Out of Parental Homes

2024-01-19T08:15:15-06:00

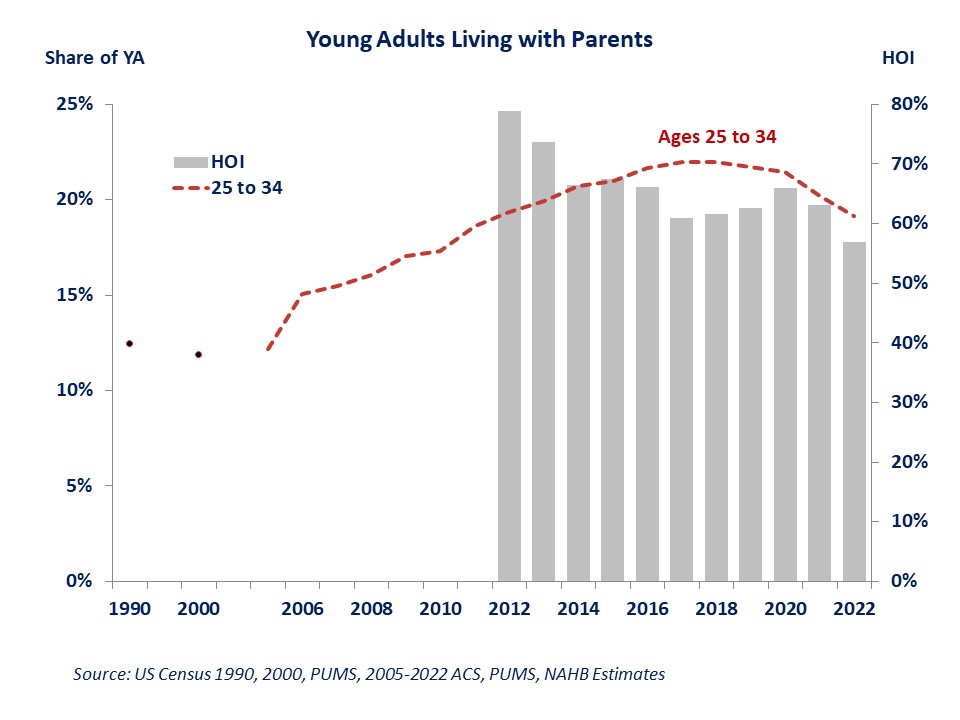
By Natalia Siniavskaia on January 19, 2024 • Despite record high inflation rates, rising interest rates, and worsening housing affordability, young adults continued the post-pandemic trend of moving out of parental homes in 2022. The share of young adults ages 25-34 living with parents or parents-in-law declined and now stands at 19.1%, according to NAHB’s analysis of the 2022 American Community Survey (ACS) Public Use Microdata Sample (PUMS). This percentage is a decade low and a welcome continuation of the post-pandemic trend towards rising independent living by adults ages 25-34. Traditionally, young adults ages 25 to 34 make up around half of all first-time homebuyers. Consequently, the number and share of young adults in this age group that choose to stay with their parents or parents-in-law has profound implications for household formation, housing demand, and the housing market. The share of adults ages 25 to 34 living with parents reached a peak of 22% in 2017-2018. Even though an almost three percentage point drop in the share since then is a welcome development that the housing market has been waiting for, the share remains elevated by historical standards, with almost one in five young adults in parental homes. Two decades ago, less than 12% of young adults ages 25 to 34, or 4.6 million, lived with parents. The current share of 19.1% translates into 8.5 million of young adults living in homes of their parents or parents-in-law. Stacking our estimates of the share of young adults living with parents against NAHB/Wells Fargo’s HOI data reveals that until the pandemic, the rising share of young adults living with parents had been associated with worsening affordability. Conversely, improving housing affordability, had been linked with a declining share of 25–34-year-old adults continuing to live in parental homes.  The strong negative correlation disappeared in the post-pandemic world, with young adults continuing to move out of parental homes despite worsening housing affordability and rising cost of independent living. The “excess” savings accumulated early in the lockdown stages of the pandemic, when spending opportunities were limited, undoubtedly helped finance the move-out trend. Will the trend continue once young adults drain their “excess” savings? The NAHB forecast highlights strong labor market conditions and expectations for receding mortgage rates that should improve housing affordability in the near future. Combined with the desire for more spacious, independent living heightened by the COVID-19 pandemic, these factors should help sustain the trend towards rising independent living of young adults even after their excess savings are depleted.  ‹ Single-Family Starts Down in December but Post Solid ShowingTags: first-time buyers, headship rates, housing, young adults living with parents

Pandemic Silver Lining: Young Adults Moving Out of Parental Homes2024-01-19T08:15:15-06:00

About My Work

Phasellus non ante ac dui sagittis volutpat. Curabitur a quam nisl. Nam est elit, congue et quam id, laoreet consequat erat. Aenean porta placerat efficitur. Vestibulum et dictum massa, ac finibus turpis.

Recent Works

Recent Posts