Inflation Remains Sticky due to Persistent Housing Costs
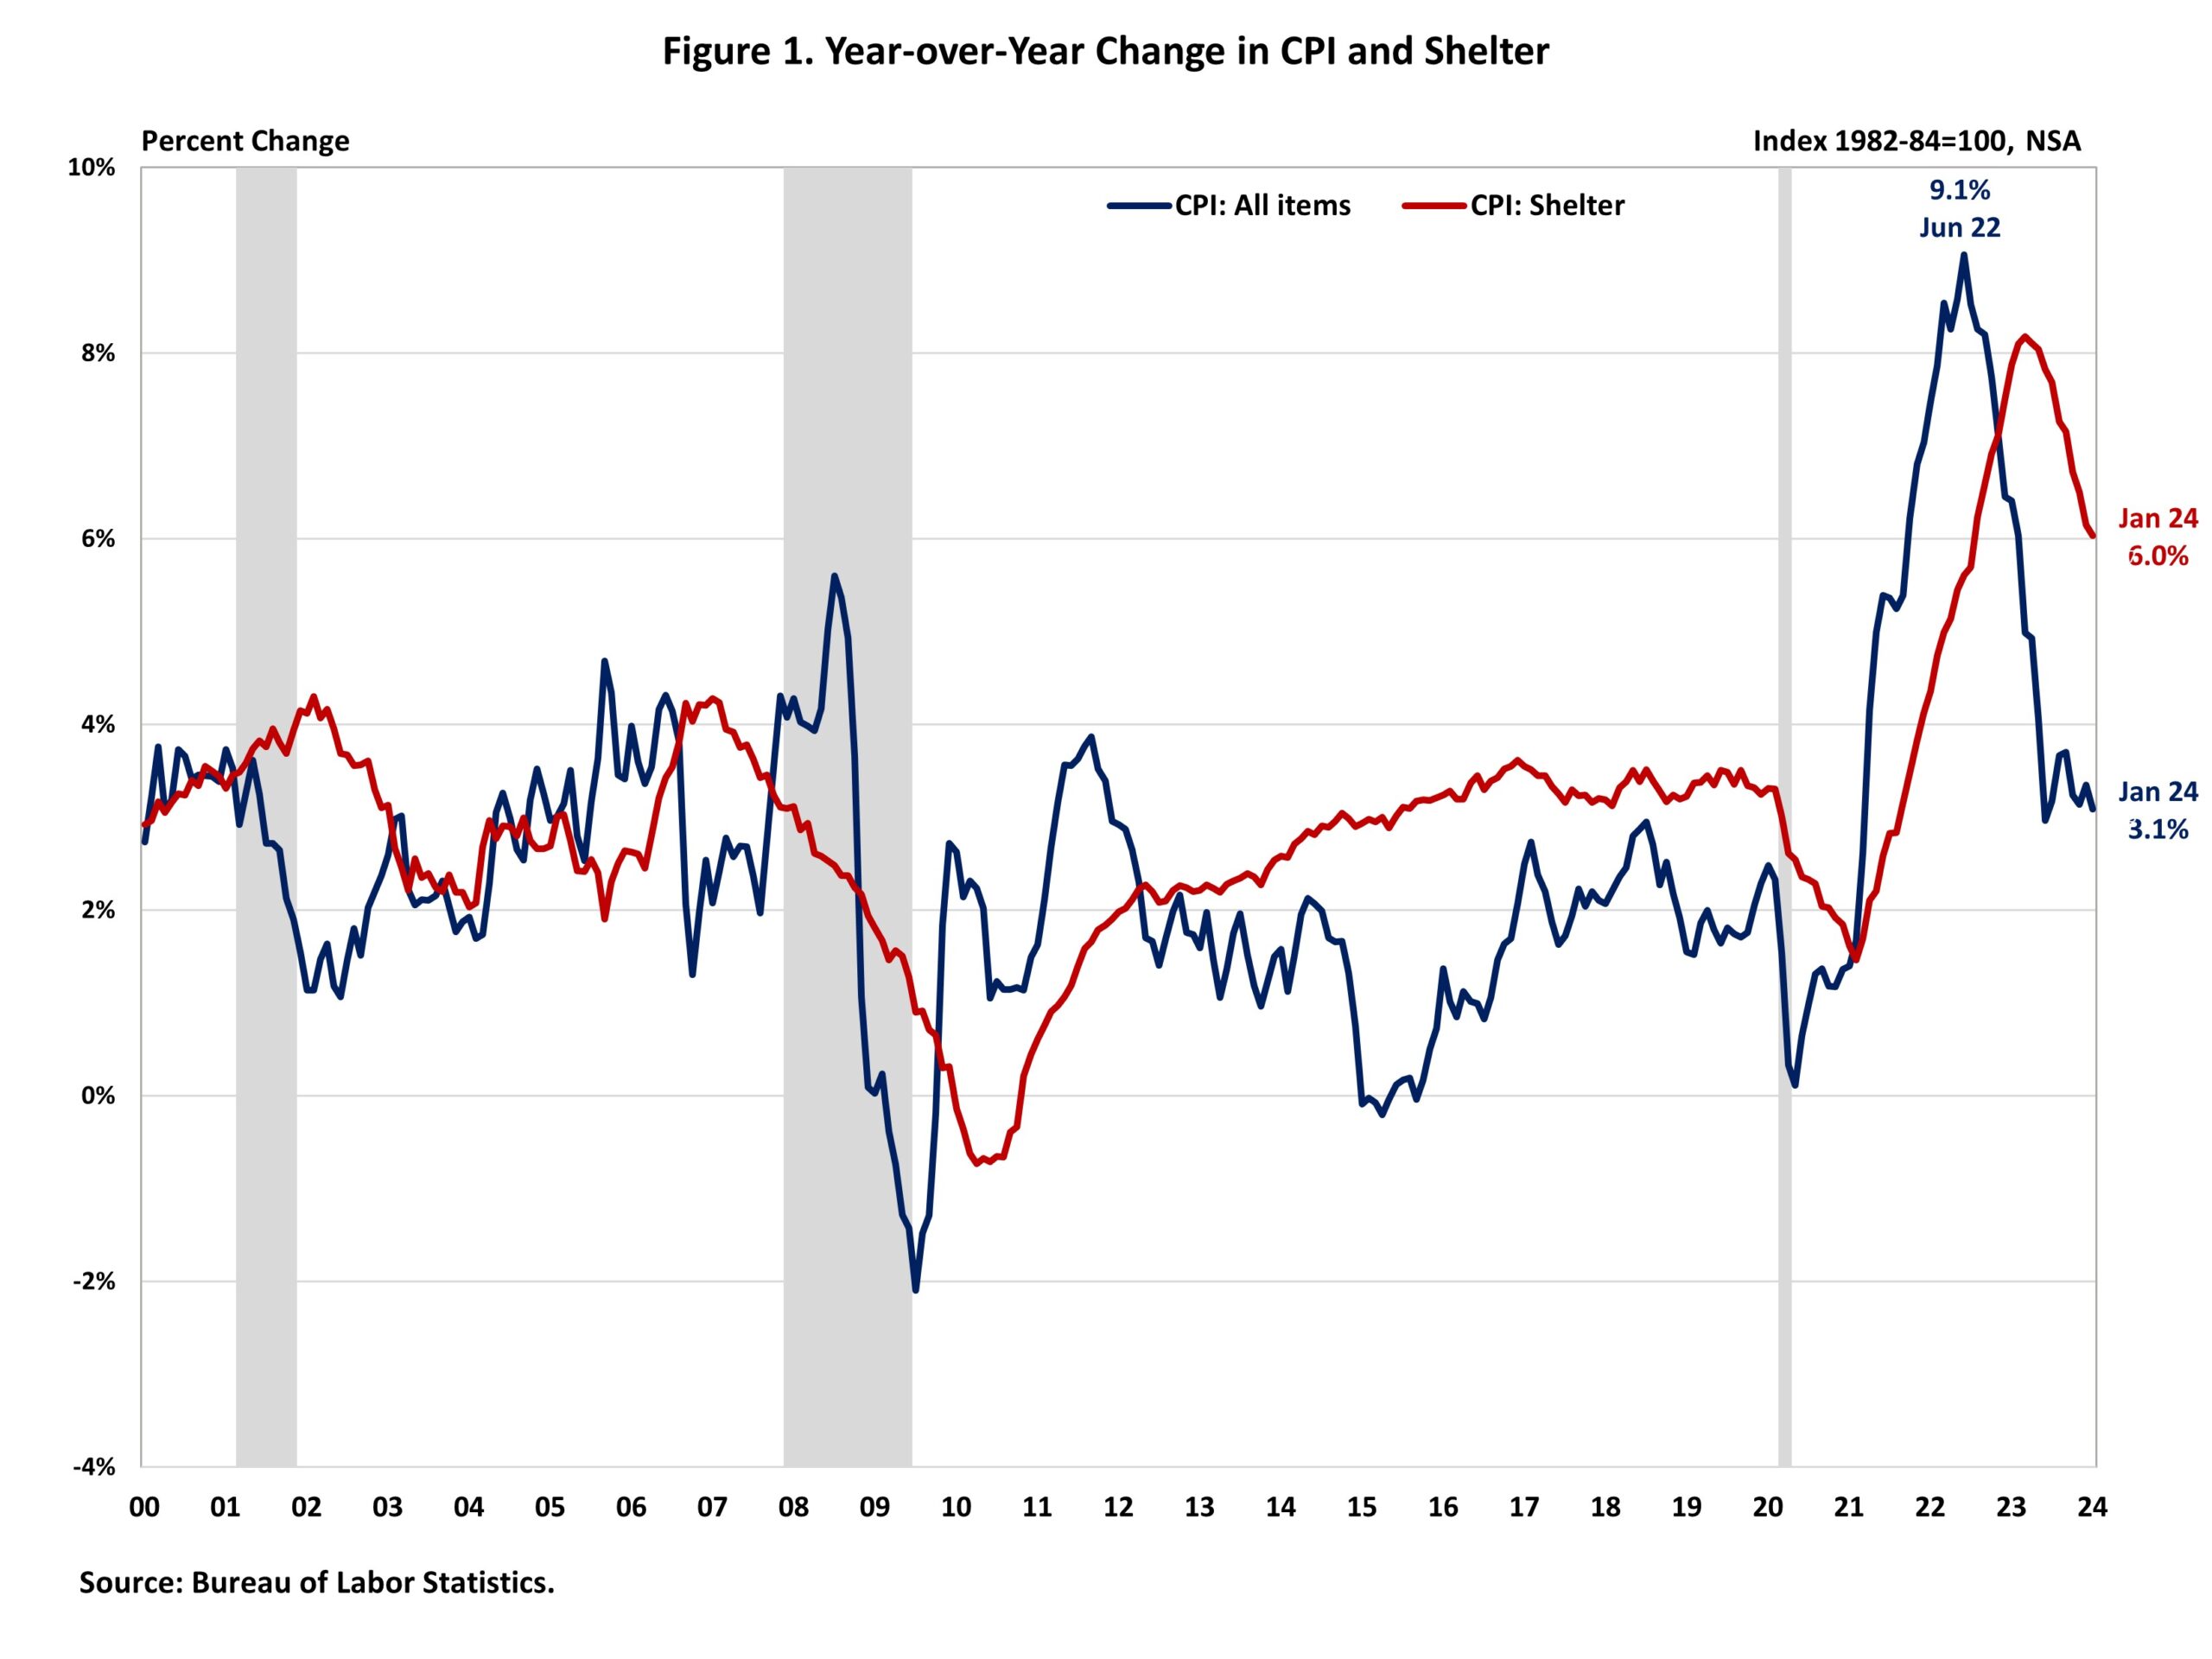
Fan-Yu Kuo2024-02-13T11:15:21-06:00Consumer prices picked up again in January while core prices remained elevated, especially housing costs. Despite a slowdown in the year-over-year increase, shelter costs continue to put upward pressure on inflation, accounting for over two-thirds of the total increase in all items excluding food and energy. This hotter-than-expected report will almost certainly delay Fed rate cuts until the second half of the year. The Fed’s ability to address rising housing costs is limited because increases are driven by a lack of affordable supply and increasing development costs. Additional housing supply is the primary solution to tame housing inflation. The Fed’s tools for promoting housing supply are constrained. In fact, further tightening of monetary policy would hurt housing supply because it would increase the cost of AD&C financing. This can be seen on the graph below, as shelter costs continue to rise despite Fed policy tightening. Nonetheless, the NAHB forecast expects to see shelter costs decline further in the coming months. This is supported by real-time data from private data providers that indicate a cooling in rent growth. With respect to the aggregate data, the Bureau of Labor Statistics (BLS) reported that the Consumer Price Index (CPI) rose by 0.3% in January on a seasonally adjusted basis, after rising 0.2% in December. The price index for a broad set of energy sources fell by 0.9% in January as the decline in gasoline index (-3.3%) and fuel oil index (-4.5%) more than offset the increase in the natural gas index (+2.0%) and electricity index (+1.2%). Meanwhile, the food index and the food at home index both increased by 0.4% in January. Excluding the volatile food and energy components, the “core” CPI rose by 0.4% in January, after rising 0.3% in December. In January, the index for shelter (+0.6%) continued to be the largest contributor to the monthly increase in the core CPI. Among other top contributors that rose in January include indexes for motor vehicle insurance (+1.4%) and medical care (+0.5%). Meanwhile, the top contributors that experienced a decline in January include indexes for used cars and trucks (-3.4%) and apparel (-0.7%). The index for shelter makes up more than 40% of the “core” CPI. The index saw a 0.6% rise in January, following an increase of 0.4% in December. The indexes for owners’ equivalent rent (OER) increased by 0.6% and rent of primary residence (RPR) increased by 0.4% over the month. These gains have been the largest contributors to headline inflation in recent months. During the past twelve months, on a non-seasonally adjusted basis, the CPI rose by 3.1% in January, following a 3.4% increase in December. The “core” CPI increased by 3.9% over the past twelve months, the same increase for the 12-months ending December. This was the slowest annual gain since May 2021. Over the past twelve months, the food index rose by 2.7% while the energy index fell by 2.0%. NAHB constructs a “real” rent index to indicate whether inflation in rents is faster or slower than overall inflation. It provides insight into the supply and demand conditions for rental housing. When inflation in rents is rising faster than overall inflation, the real rent index rises and vice versa. The real rent index is calculated by dividing the price index for rent by the core CPI (to exclude the volatile food and energy components). The Real Rent Index was unchanged in January. ‹ Modest Improvements in Demand, Lending Conditions for Real Estate Loans During Q4 2023Tags: BLS, cpi, inflation