State and Local Property Tax Revenue Grows in the First Quarter
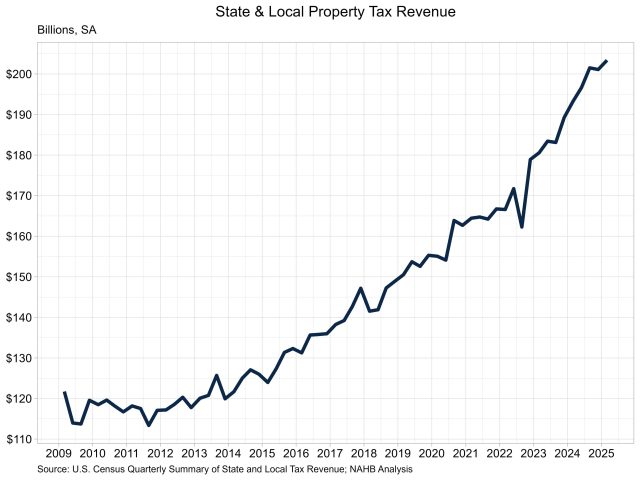
Jesse Wade2025-06-27T09:22:07-05:00In the first quarter of 2025, state and local governments experienced an increase in property tax revenue growth. On a seasonally adjusted basis, state and local government property tax revenue grew 1.1% over the quarter, according to the Census Bureau’s quarterly summary of state and local tax revenue. Meanwhile, total tax revenue for state and local governments grew 1.3% over the quarter, with corporate income tax revenue up 6.6%, sales tax revenue up 0.9% and individual income tax revenue up 0.2%. Property tax revenue stood at $203.4 billion in the first quarter, a slight increase from $201.1 billion in the fourth quarter. While this does show growth over the quarter, growth has notably slowed over the past year. The quarterly growth in the first quarter of 2024 was almost double (2.1%) the current rate. On a year-over-year basis, property tax revenue was 5.2% higher, up from $193.3 billion. Property taxes typically make up the largest share of the total tax revenue for state and local governments, accounting for over one-third at 37.8% in the first quarter. The second highest revenue source was sales tax at 27.7%, totaling $148.9 billion, followed closely by individual income tax at 26.1% ($140.5 billion). Corporate income tax rounded out the remaining 8.4% at $45.4 billion. Discover more from Eye On Housing Subscribe to get the latest posts sent to your email.