Job Growth Slowed in August
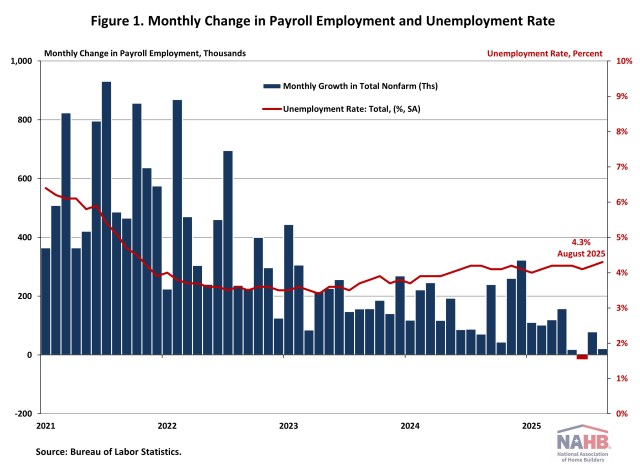
Web Master2025-09-05T10:15:54-05:00Job growth slowed sharply in August, and the unemployment rate rose to its highest level in nearly four years. The latest jobs report, along with downward revisions to previous months’ data, indicates a continued cooling in the U.S. labor market. This softening trend is likely to increase pressure on the Federal Reserve to consider an interest rate cut at its upcoming September meeting. In August, wage growth slowed. Year-over-year, wages grew at a 3.7% rate, down 0.2 percentage points from the previous month. Despite the deceleration, wage growth has been outpacing inflation for nearly two years, which typically occurs as productivity increases. National Employment According to the Employment Situation Summary reported by the Bureau of Labor Statistics (BLS), total nonfarm payroll employment showed little change in August, with a modest gain of 22,000 jobs. June’s job growth was revised down by 27,000, from an initial estimate of +14,000 to -13,000, making the first negative monthly job growth since January 2010. July’s job growth was revised up by 6,000, from 73,000 to 79,000. Combined, the revisions erased 21,000 jobs from previously reported figures. So far in 2025, monthly job growth has averaged 75,000, a significant slowdown compared to the 168,000 monthly average gain for 2024. The unemployment rate rose to 4.3% in August, its highest level in nearly four years. The August increase in the unemployment rate reflected the increase in the number of persons unemployed (+148,000) and the increase in the number of persons employed (+288,000). Meanwhile, the labor force participation rate—the proportion of the population either looking for a job or already holding a job—edged up by 0.1 percentage points to 62.3%. This remains below its pre-pandemic level of 63.3% recorded at the beginning of 2020. Among prime working-age individuals (aged 25 to 54), the participation rate rose by 0.3 percentage points to 83.7%, the highest level since October 2024. In August, employment continued to trend up in health care (+31,000) and in social assistance (+16,000), while employment in federal government, mining, wholesale trade, and manufacturing sectors experienced job losses. Federal government employment declined by 15,000 jobs in August and has now shed a total of 97,000 positions since peaking in January 2025. The BLS notes that “employees on paid leave or receiving ongoing severance pay are counted as employed in the establishment survey.” Construction Employment Employment in the overall construction sector declined by 7,000 in August, marking the third consecutive month of job losses in the industry. Downward revisions to June and July figures further underscore the sector’s ongoing weakness. Within the industry, residential construction lost 6,100 jobs, while non-residential construction employment declined by 1,200 jobs during the month. Residential construction employment now stands at 3.3 million in August, broken down as 954,000 builders and 2.4 million residential specialty trade contractors. The six-month moving average of job gains for residential construction was -4,783 a month, reflecting the five months of job losses recorded over the past six months, specifically in March, May, June, July, and August of 2025. Over the last 12 months, home builders and remodelers experienced a net loss of 26,100 jobs, marking the fourth annual decline since September 2020. Since the low point following the Great Recession, residential construction has gained 1,345,300 positions. In August, the unemployment rate for construction workers rose to 3.9% on a seasonally adjusted basis. The unemployment rate for construction workers has remained at a relatively lower level, after reaching 15.3% in April 2020 due to the housing demand impact of the COVID-19 pandemic. Discover more from Eye On Housing Subscribe to get the latest posts sent to your email.