State-Level Analysis of Canadian Softwood Lumber Trade
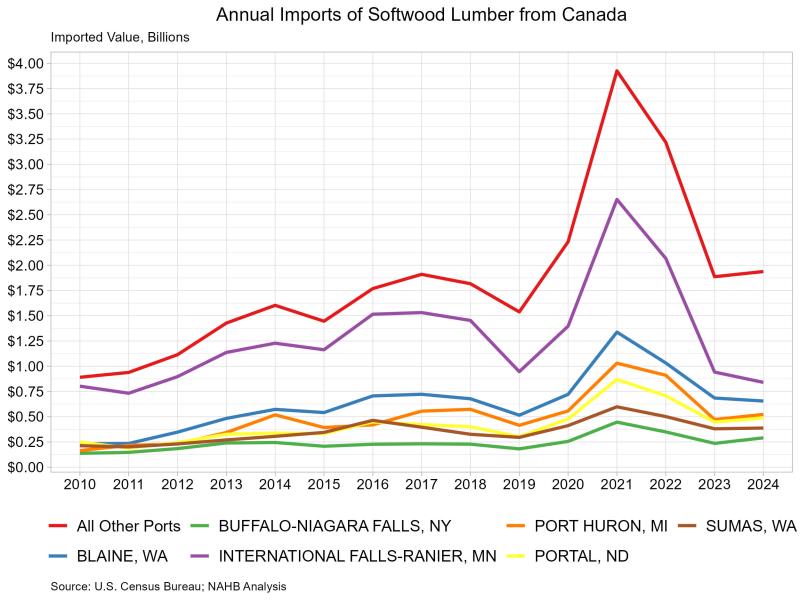
Web Master2025-11-11T09:15:24-06:00International trade remains a source of volatility across the building materials sector, particularly in the softwood lumber market. Recent adjustments to antidumping and countervailing duty (AD/CVD) rates, combined with the imposition of Section 232 tariffs, have increased the trade-related cost of Canadian imports. As a result, the average duty rate on Canadian softwood lumber entering the U.S. has tripled, now hovering around 45%. These elevated trade barriers pose additional challenges for home builders who rely on Canadian lumber to meet construction demand. In 2024, Canadian softwood lumber exports to the U.S. totaled $5.1 billion, accounting for approximately 74% of the total value of softwood lumber imports. Canada remains the dominant supplier and a longstanding trade partner in the sector. Trade data from the U.S. Census Bureau enables tracking of import destinations at the state level. The majority of Canadian softwood lumber enters through the International Falls, MN port of entry, which saw $840 million in imports in 2024, which is roughly $150 million more than the next busiest port, Blaine, WA. These figures represent a decline from 2021 and 2022, largely due to lower U.S. lumber prices during the current period. This analysis invites the question of where Canadian softwood lumber imports are ultimately headed within the United States. In 2024, Washington state was the top destination, receiving $560.1 million worth of imports. Texas followed closely behind with $451.7 million, reflecting strong demand in the southern housing market. On the other end of the spectrum, Alaska recorded the lowest import volume, with just $284,053 in softwood lumber shipments. However, it is important to note a key limitation in the data. The “state of destination” reflects where the importer is located or where the shipment is initially received, not necessarily where the lumber is ultimately used. This means that while trade data can highlight logistical patterns, it does not fully capture the final point of consumption, especially in cases where materials are redistributed across state lines.