Existing Home Sales Rise in October
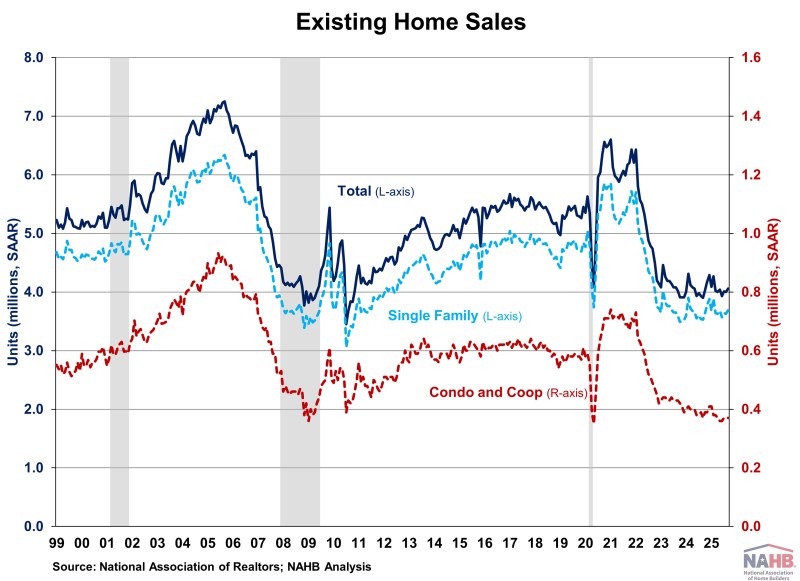
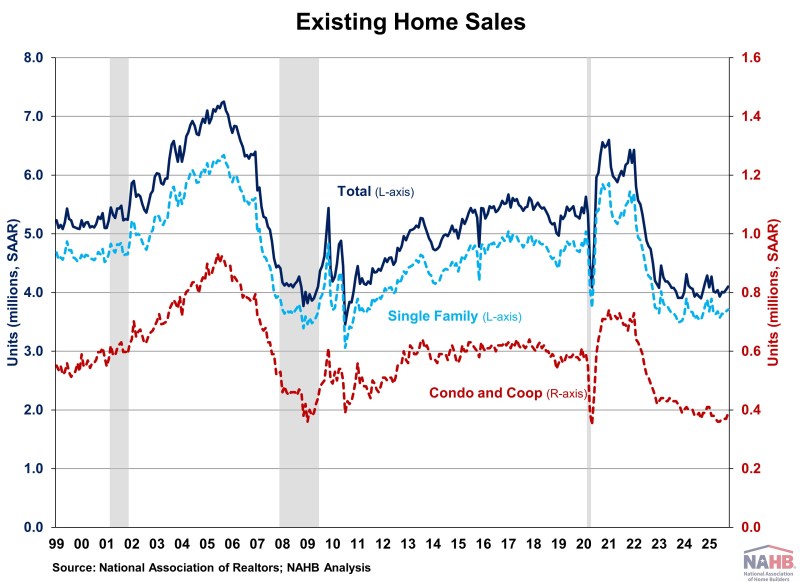
Web Master2025-11-20T12:17:28-06:00Existing home sales rose to an eight-month high in October as buyers took advantage of lower mortgage rates, according to the National Association of Realtors (NAR). Resale inventory improved from a year ago but remained below pre-pandemic levels. Relatively tight supply continued to push home prices higher and challenge housing affordability. These affordability pressures vary by region, with first-time buyers in the Northeast facing limited inventory, while buyers in the West struggle with elevated home prices. Mortgage rates hovered between 6.5% and 7% earlier this year due to economic and tariff uncertainty. However, with the Fed resuming rate cuts in September, mortgage rates have fallen gradually. As of October 30th, the average mortgage rate decreased to 6.17%, the lowest in over a year. With additional rate cuts expected in coming months, lower mortgage rates and improved inventory should bring more buyers and sellers into the market. Total existing home sales, including single-family homes, townhomes, condominiums, and co-ops, rose 1.2% to a seasonally adjusted annual rate of 4.10 million in October, the highest level since February. On a year-over-year basis, sales were 1.7% higher than a year ago. The existing home inventory level was 1.52 million units in October, down 0.7% from September but up 10.9% from a year ago. At the current sales rate, October unsold inventory sits at a 4.4-months’ supply, down from 4.5-months in September but up from 4.1-months in October 2024. Inventory between 4.5 to 6 months’ supply is generally considered a balanced market. Homes stayed on the market for a median of 34 days in October, up from 33 days last month and 29 days in October 2024. The first-time buyer share was 32% in October, up from 30% in September and 27% from a year ago. The October all-cash sales share was 29% of transactions, down from 30% in September but up from 27% a year ago. All-cash buyers are less affected by changes in interest rates. The October median sales price of all existing homes was $415,200, up 2.1% from last year. This marks the 28th consecutive month of year-over-year increases. The median condominium/co-op price in October was up 0.9% from a year ago at $363,700. Recent gains for home inventory will put downward pressure on resale home prices in most markets in 2025. Existing home sales in October were mixed across the four major regions. Sales rose in the Midwest (5.3%) and South (0.5%), fell in the West (-1.3%), and remained unchanged in the Northeast. On a year-over-year basis, sales were up in the Northeast (4.3%), South (2.8%) and Midwest (2.1%), while down in the West (-2.6%). The Pending Home Sales Index (PHSI) is a forward-looking indicator based on signed contracts. The PHSI remained unchanged at 74.8 in September, suggesting job market concerns kept buyers on the sideline despite mortgage rates near one-year lows. On a year-over-year basis, pending sales were 0.9% lower than a year ago, according to the National Association of Realtors’ data.