U.S. Economic Growth Slows in First Quarter
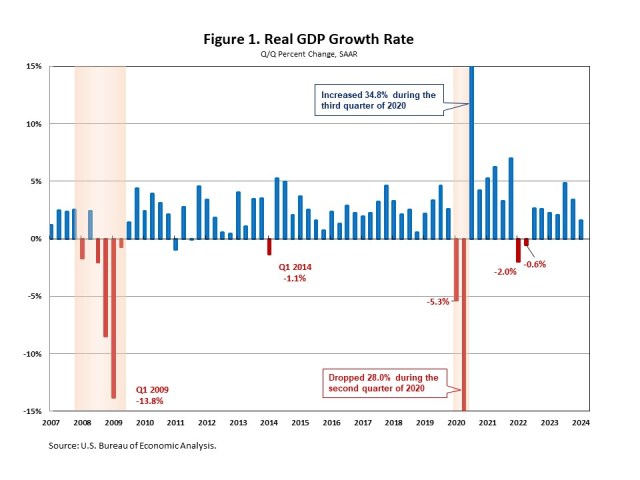
Jing Fu2024-04-25T11:15:29-05:00Compared to the fourth quarter of 2023, the U.S. economy grew at a noticeably slower pace in the first quarter of 2024 due to an increase in the trade deficit and weaker inventory investment. But it was still on solid ground supported by consumers, the government, and the housing industry. Meanwhile, the data from the GDP report suggests that inflation accelerated. The GDP price index rose 3.1% for the first quarter, up from a 1.6% increase in the fourth quarter of 2023. The Personal Consumption Expenditures (PCE) Price Index, which measures inflation (or deflation) across various consumer expenses and reflects changes in consumer behavior, rose 3.4% in the first quarter. This is up from a 1.8% increase in the fourth quarter of 2024, the biggest gain in a year. According to the “advance” estimate released by the Bureau of Economic Analysis (BEA), real gross domestic product (GDP) expanded at a modest 1.6% annual pace in the first quarter of 2024. This is slower than a 3.4% gain in the fourth quarter of 2023, and the lowest annual growth rate in the past seven quarters. This quarter’s growth was lower than NAHB’s forecast of a 2.0% increase. This quarter’s increase in real GDP reflected increases in consumer spending, residential fixed investment, nonresidential fixed investment, and state and local government spending. Consumer spending, the backbone of the U.S. economy, rose at an annual rate of 2.5% in the first quarter. It reflects an increase in services that were partly offset by a decrease in goods. While expenditures on services increased 4.0% at an annual rate, goods spending decreased 0.4% at an annual rate. The decrease in goods mainly reflects decreases in motor vehicles and parts (-9.0%) and gasoline and other energy goods (-10.9%). In the first quarter of 2024, residential fixed investment (RFI) made its largest contribution to GDP growth since the first quarter of 2021. It rose 13.9% in the first quarter, up from a 2.8% increase in the fourth quarter of 2023. This is the third straight gain after nine consecutive quarters of declines. Within residential fixed investment, single-family structures rose 18.1% at an annual rate, multifamily structures declined 7.4%, and improvements rose 0.9%. Additionally, nonresidential fixed investment increased 2.9% in the first quarter, following a 3.7% increase in the previous quarter. The increase in nonresidential fixed investment mainly reflected an increase in intellectual property products (+5.4%). The increase in state and local government spending primarily reflected an increase in compensation of state and local government employees. The U.S. trade deficit increased in the first quarter as imports increased more than exports. A wider trade deficit shaved 0.86 percentage points off GDP. Imports, which are a subtraction in the calculation of GDP, increased 7.2%, while exports rose 0.9%. Discover more from Eye On Housing Subscribe to get the latest posts to your email.