Mortgage Activity Jumps after Falling for Three Consecutive Weeks
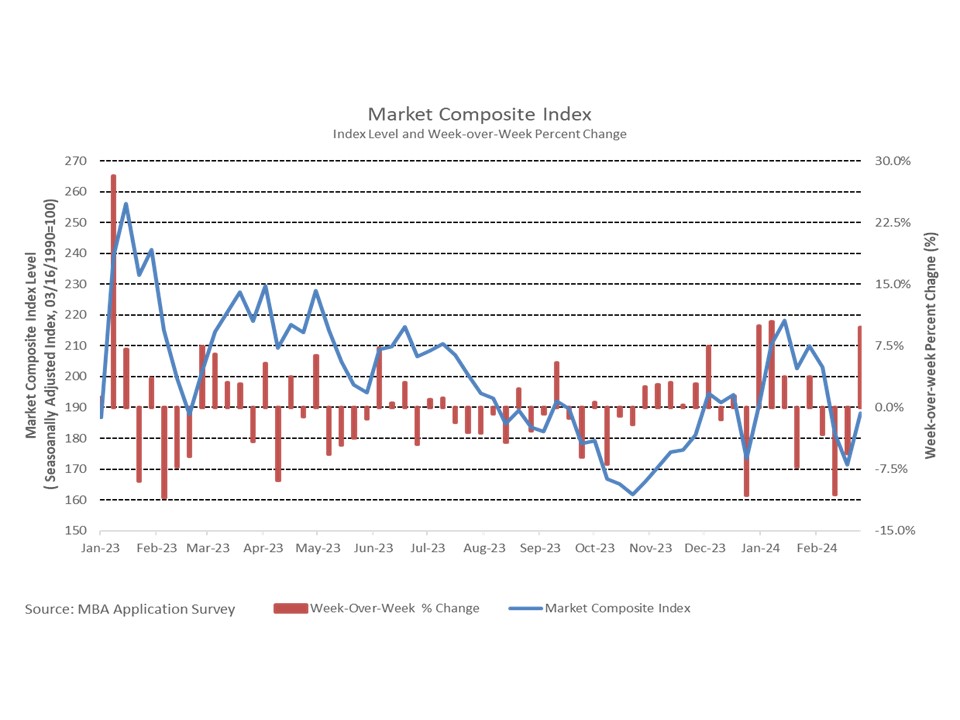
Jesse Wade2024-03-07T08:16:54-06:00Per the Mortgage Bankers Association’s (MBA) survey through the week ending March 1st, total mortgage activity increased 9.7% from the previous week, and the average 30-year fixed-rate mortgage (FRM) rate fell two basis points to 7.02%. The 30-year FRM has risen 22 basis points over the past month as rates remain right around seven percent. The Market Composite Index, a measure of mortgage loan application volume, rose by 9.7% on a seasonally adjusted (SA) basis from one week earlier after falling for three consecutive weeks. Both purchasing and refinancing activity rose, purchasing activity increased 10.6% and refinancing activity increased 8.1% week-over-week. Purchasing activity continued to be lower than a year ago, down 8.6% compared to the same week last year. Refinancing activity saw a moderate pickup as rates fell from October through the start of the year but slowed as activity for the week ending March 1st was 2.2% lower than a year ago. The refinance share of mortgage activity fell from 31.2% to 30.2% over the week, while the adjustable-rate mortgage (ARM) share of activity rose from 7.5% to 7.7%. The average loan size for purchases was $442,500 at the start of March, up from $436,200 over the month of February. The average loan size for refinancing decreased from $260,300 in February to $252,700 in February. The average loan size for an ARM was up at the start of March to $955,300, while the average loan size for a FRM rose to $337,300. Since March of 2020, when the COVID-19 was first declared a nationwide emergency, refinance and purchase average loan sizes have diverged from each other. Both amounts were near $343,000 in March 2020. As of the latest release, the average purchase loan size has risen approximately $100,000 since 2020 while the average loan size for refinance has moved the opposite direction falling about $90,000 over the same period.