Lot Values Trend Higher in 2024
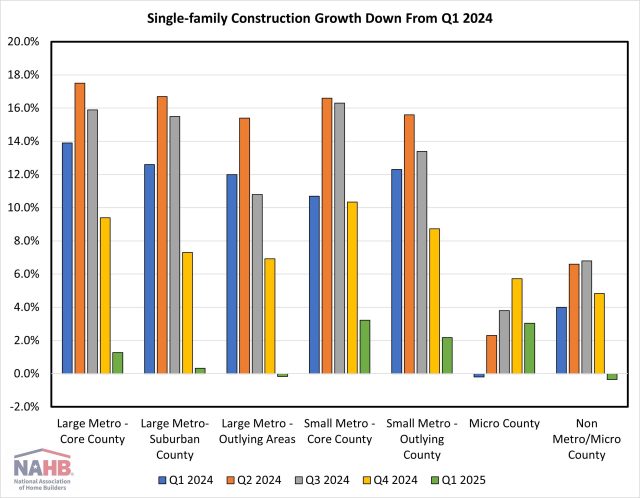
Natalia Siniavskaia2025-07-14T08:17:55-05:00Despite shrinking lot sizes, values for single-family detached spec home lots continued to rise, with the national median outpacing U.S. inflation and reaching a new high in 2024. The U.S. median lot value for single-family detached for-sale homes started in 2024 stood at $60,000, according to NAHB’s analysis of the Census Bureau’s Survey of Construction (SOC) data. Even though the national median lot value grew faster than U.S. inflation in 2024, it remains below the record levels of the housing boom of 2005-2006, when adjusted for inflation. At that time, half of the lots were valued at or over $43,000, equivalent to about $67,000 when converted into inflation-adjusted 2024 dollars. Rising lot values stand out against the backdrop of dramatic shifts towards smaller lots in new spec home construction in recent years. Since the housing boom of 2005-2006, the share of lots under 1/5 of an acre rose from 48% in 2005 to 65% in 2024. Consequently, even though current median lot values are not record-breaking in real terms, they reflect a very different mix of lots compared to the housing boom years or even a decade ago. The fact that lot values continue to appreciate as their sizes shrink reflects ongoing challenges builders face in obtaining lots. Although lot shortages are not quite as widespread as they were in 2021, their current incidence, recorded by the May 2025 survey for the NAHB/Wells Fargo Housing Market Index (HMI), remains elevated, with 64% of builders rating the supply of developed lots as low or very low. There is a substantial variation in lot values and appreciation across U.S. regions. New England and the Pacific stand out as the two divisions with the most expensive lots. Per the latest SOC data, half of all single-family detached (SFD) spec homes started in New England in 2024 were built on lots valued at or over $150,000. New England is known for strict local zoning regulations that often require very low density. As a matter of fact, the median lot size for single-family detached spec homes started in New England in 2024 was three times the national median. Therefore, it is not surprising that typical SFD spec homes in New England are built on some of the largest and most expensive lots in the nation. The regional differences in lot sizes cannot fully explain the wide variation in lot values. The Pacific division, where the developable land is scarce, has the smallest lots. However, its median lot value reached $152,000 in 2024, the highest median in the nation. As a result, the Pacific division lots stand out as the most expensive in the country in terms of cost per acre. The Middle Atlantic division hit a new record high in 2024, with half of the lots for SFD spec home starts valued at or above $97,000. This made the Middle Atlantic the third most expensive division in the U.S. The East South Central and South Atlantic divisions are home to some of the least expensive spec home lots in the nation. The East South Central division recorded the lowest median lot value, at $48,000. Typical lots here are also significantly larger than the national median, thus defining some of the most economical lots, as well as the lowest cost per acre in the U.S. The neighboring South Atlantic is another division where the median lot value ($53,000) is below the national median of $60,000. Lots in the West South Central, which includes Texas, appreciated dramatically over the last decade. In 2012, half of the SFD spec homes were started on lots valued at or below $30,000, close to half of the current median of $58,000. For this analysis, median lot values were chosen over averages, since averages tend to be heavily influenced by extreme outliers. In addition, the Census Bureau often masks extreme lot values in the public use SOC dataset, making it difficult to calculate averages precisely, but medians remain unaffected by these procedures. This analysis is limited to single-family speculatively built homes by year started and with reported sales prices. For custom homes built on an owner’s land with either the owner or a builder acting as the general contractor, the corresponding land values are not reported in the SOC. Consequently, custom homes are excluded from this analysis. Discover more from Eye On Housing Subscribe to get the latest posts sent to your email.