Affordability Pyramid Shows 94 Million Households Cannot Buy a $400,000 Home 

2025-03-31T09:20:54-05:00

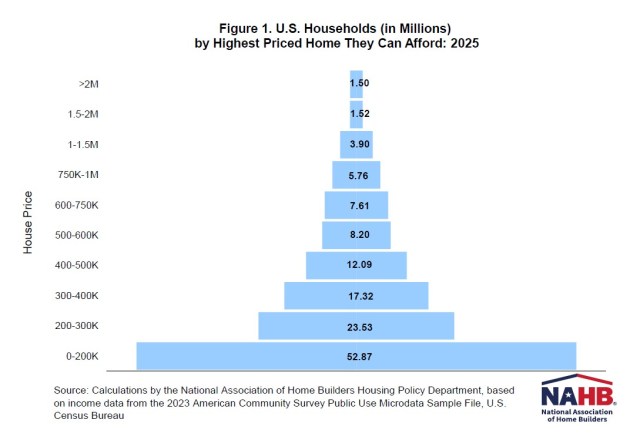
NAHB recently released its 2025 Priced-Out Analysis, highlighting the housing affordability challenge. While previous posts discussed the impacts of rising home prices and interest rates on affordability, this post focuses on the related U.S. housing affordability pyramid. The pyramid reveals that 70% of households (94 million) cannot afford a $400,000 home, while the estimated median price of a new home is around $460,000 in 2025. The housing affordability pyramid illustrates the number of households able to purchase a home at various price steps. Each step represents the number of households that can only afford homes within that specific price range. The largest share of households falls within the first step, where homes are priced under $200,000. As home prices increase, fewer and fewer households can afford the next price level, with the highest-priced homes—those over $2 million—having the smallest number of potential buyers. Housing affordability remains a critical challenge for households with income at the lower end of the spectrum. The pyramid is based on income thresholds and underwriting standards. Under these assumptions, the minimum income required to purchase a $200,000 home at the mortgage rate of 6.5% is $61,487. In 2025, about 52.87 million households in the U.S. are estimated to have incomes no more than that threshold and, therefore, can only afford to buy homes priced up to $200,000. These 52.87 million households form the bottom step of the pyramid. Of the remaining households who can afford a home priced at $200,000, 23.53 million can only afford to pay a top price of somewhere between $200,000 and $300,000. These households make up the second step on the pyramid. Each subsequent step narrows further, reflecting the shrinking number of households that can afford increasingly expensive homes. It is worthwhile to compare the number of households that can afford homes at various price levels and the number of owner-occupied homes available in those ranges (excludes homes built-for-rent), as shown in Figure 2. For example, while around 53 million households can afford a home priced at $200,000 or less, there are only 22 million owner-occupied homes valued in this price range. This trend continues in the $200,000 to $300,000 price range, where the number of households that can afford homes is much higher than the number of housing units in that range. These imbalances show a shortage of affordable housing. Discover more from Eye On Housing Subscribe to get the latest posts sent to your email.

Affordability Pyramid Shows 94 Million Households Cannot Buy a $400,000 Home 2025-03-31T09:20:54-05:00

Mortgage Rates Hold Steady After Early March Drop

2025-03-27T12:15:38-05:00

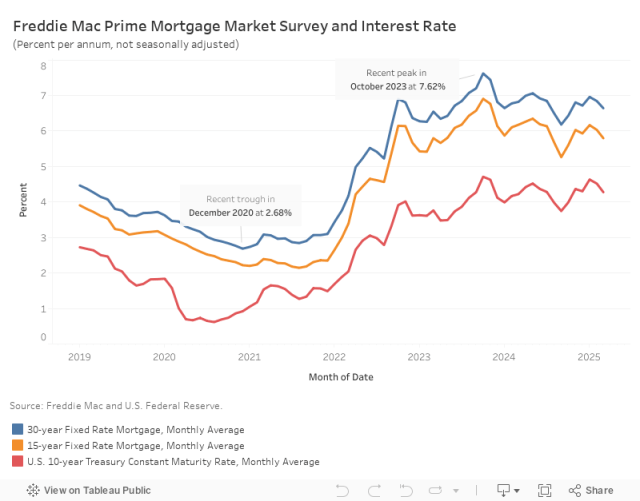
Mortgage rates dropped significantly at the start of March before stabilizing, with the average 30-year fixed-rate mortgage settling at 6.65%, according to Freddie Mac. This marks a 19-basis-point (bps) decline from February. Meanwhile, the 15-year fixed-rate mortgage fell by 20 bps to 5.83%. The drop in long-term borrowing costs was driven by a 24-bps decline in the 10-year Treasury yield, which averaged 4.28% in March. This decline provided a boost to the housing market—new home sales increased 5.1% year-over-year in February, while the participation of first-time homebuyer of existing homes rose 26% over the same period. However, existing home sales saw a slight dip from last February. The decrease in Treasury yields reflects growing concerns about an economic slowdown, particularly as shifts in tariff policy weaken consumer confidence. Despite this, the labor market remained resilient in February, posting steady job gains even as the unemployment rate ticked up slightly. The strength of upcoming jobs reports will be critical in assessing whether recession risks are intensifying. At the latest FOMC meeting, the Federal Reserve held interest rates steady but revised its 2025 economic projections: expected GDP growth was lowered to 1.7% (down from 2.1% in December 2024) and the projected unemployment rate was raised to 4.4%, up 0.1 percentage point from previous estimates. Discover more from Eye On Housing Subscribe to get the latest posts sent to your email.
Mortgage Rates Hold Steady After Early March Drop2025-03-27T12:15:38-05:00

Property Tax Revenue Outpaces Other Sources in 2024

2025-03-26T08:17:50-05:00

Property tax revenue collected by state and local governments reached a new high in 2024 and continued to make up a bulk of tax revenue. Total tax revenue for state and local governments also reached a high after falling in 2023, driven by higher revenue across all sources. In 2024, tax revenue totaled $2.095 trillion, up 4.6% from $2.004 trillion in 2023. According to the Census Bureau’s Quarterly Summary of State and Local Taxes, state and local property tax revenue totaled $797.0 billion (38.0%), up 8.2% from the prior year. Individual income tax totaled $537.4 billion (25.6%), up 4.7% over the year. Corporate income tax totaled $174.5 billion (8.3%), up 0.2% and general sales tax revenue was up 1.2% to $587.0 billion (28.0%) in 2024. State Level Detail Separating out this summary to just the state level, property taxes accounted for only 1.6% of state tax revenue in 2024, totaling $24.3 billion. State tax revenue is mostly comprised of individual income tax and general sales tax, with individual income tax reaching $490.7 billion (32.9%) and general sales tax at $470.0 billion (31.5%) in 2024. Additionally, the state where government tax revenue was most reliant on property tax was Vermont, where approximately 27.7% of the state’s tax revenue was from property tax. Seventeen states did not collect any tax revenue in the form of property tax. This means that for property tax within a state, all collections essentially remain at the local government level. Discover more from Eye On Housing Subscribe to get the latest posts sent to your email.

Property Tax Revenue Outpaces Other Sources in 20242025-03-26T08:17:50-05:00

Consumer Expectations Fall Again

2025-03-25T16:18:41-05:00

Consumer confidence fell for the fourth straight month amid growing concerns about the economic outlook and policy uncertainties, especially potential tariffs. Uncertainties continue to weigh on consumer sentiment as consumer confidence dropped to a 4-year low and expectations for the future economy fell to a 12-year low. The persistent decline in sentiment has raised recession concerns as consumers have grown pessimistic about economic conditions. The Consumer Confidence Index, reported by the Conference Board, is a survey measuring how optimistic or pessimistic consumers feel about their financial situation. This index fell from 100 to 92.9 in March, the largest monthly decline since August 2021 and the lowest level since February 2021. The Consumer Confidence Index consists of two components: how consumers feel about their present situation and about their expected situation. The Present Situation Index decreased 3.6 points from 138.1 to 134.5, and the Expectation Situation Index dropped 9.6 points from 74.8 to 65.2, the lowest level since February 2013. This is the second consecutive month that the Expectation Index has been below 80, a threshold that often signals a recession within a year. Consumers’ assessment of current business conditions turned negative in March. The share of respondents rating business conditions “good” decreased by 1.4 percentage points to 17.7%, while those claiming business conditions as “bad” rose by 1.8 percentage points to 16.7%. However, consumers’ assessments of the labor market improved slightly. The share of respondents reporting that jobs were “plentiful” remained unchanged at 33.6%, and those who saw jobs as “hard to get” decreased by 0.3 percentage points to 15.7%. Consumers were pessimistic about the short-term outlook. The share of respondents expecting business conditions to improve fell from 20.8% to 17.1%, while those expecting business conditions to deteriorate rose from 25.5% to 27.3%. Similarly, expectations of employment over the next six months were less positive. The share of respondents expecting “more jobs” decreased by 2.1 percentage points to 16.7%, and those anticipating “fewer jobs” climbed by 1.9 percentage points to 28.5%. The Conference Board also reported the share of respondents planning to buy a home within six months. The share of respondents planning to buy a home rose slightly to 5.4% in March. Of those, respondents planning to buy a newly constructed home increased to 0.5%, and those planning to buy an existing home dropped to 2.3%. The remaining 2.6% were planning to buy a home but undecided between new or existing homes. Discover more from Eye On Housing Subscribe to get the latest posts sent to your email.

Consumer Expectations Fall Again2025-03-25T16:18:41-05:00

Lower Mortgage Rates, Better Affordability

2025-03-24T11:19:31-05:00

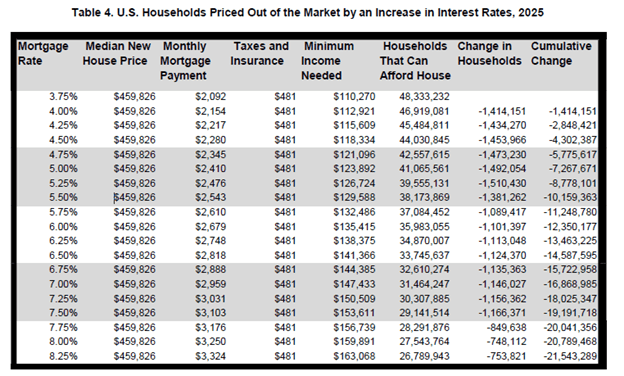
As housing affordability remains a critical challenge across the country, mortgage rates continue to play a central role in shaping homebuying power. Mortgage rates stayed elevated throughout 2023 and early 2024. Recent data, however, shows a modest decline in mortgage rates. Even slight declines can have a significant impact on housing affordability, pricing more households back into the market. New NAHB Priced-Out Estimates show how home price increases affect housing affordability in 2025. This post presents details regarding how interest rates affect the number of households that can afford a median priced new home. At the beginning of 2025, with the average 30-year fixed mortgage rate at 7%, around 31.5 million households could afford a median-priced home at $459,826. This requires a household income of $147,433 by the front-end underwriting standards[1]. In contrast, if the average mortgage rates had remained at the recent peak of 7.62% in October 2023, only 28.7 million households would have qualified. This 62-basis point decline has effectively priced 2.8 million additional households into the market, expanding homeownership opportunities. The table below shows how affordability changes with each 25 basis-point increase in interest rates, from 3.75% to 8.25% for a median-priced home at $459,826. The minimum required income with a 3.75% mortgage rate is $110,270. In contrast, a mortgage rate of 8.25%, increases the required income to $163,068, pushing millions of households out of the market. As rates climb higher, the priced-out effect diminishes. When interest rates increase from 6.5% to 6.75%, around 1.13 million households are priced out of the market, unable to meet the higher income threshold required to afford the increased monthly payments. However, an increase from 7.75% to 8% would squeeze about 850,000 households out of the market. This exemplifies that when interest rates are relatively low, a 25 basis-point increase has a much larger impact. It is because it affects a broader portion of households in the middle of the income distribution. For example, if the mortgage interest rate decreases from 5.25% to 5%, around 1.5 million more households will qualify the mortgage for the new homes at the median price of $459,826. This indicates lower interest rates can unlock homeownership opportunities for a substantial number of households. [1] . The sum of monthly payment, including the principal amount, loan interest, property tax, homeowners’ property and private mortgage insurance premiums (PITI), is no more than 28 percent of monthly gross household income. Discover more from Eye On Housing Subscribe to get the latest posts sent to your email.
Lower Mortgage Rates, Better Affordability2025-03-24T11:19:31-05:00

People Not in the Labor Force

2025-03-24T10:17:03-05:00

According to the U.S. Bureau of Labor Statistics (BLS), people who are neither working nor looking for work are counted as “not in the labor force”. Understanding the size and characteristics of individuals not in the labor force is crucial for a comprehensive assessment of the job market and overall economic health, as it provides insights into potential labor supply and demand issues. Size The number of people not in the labor force has been steadily increasing. As of February 2025, data from the BLS indicates that 102.5 million people, aged 16 or older, were not in the labor force. During the COVID-19 pandemic, this figure surged sharply, rising from 95.2 million in February 2020 to a historically high 103.6 million in April 2020. Since then, the number has remained around 100 million, with a noticeable upward trend over the past year. Characteristics Data from the 2024 Current Population Survey (CPS) and the Annual Social and Economic Supplement (ASEC) offer valuable insights into why individuals are not in the labor force. The ASEC gathers information on employment and unemployment experienced during the previous calendar year. The data used in this article focus on individuals aged 16 years and older who neither worked nor looked for a job in 20231. According to the analysis of the data from the 2024 CPS and ASEC, approximately 93.6 million people aged 16 or older were not in the labor force in 2023. Among this group, nearly 39 million (42%) were men, and 54.6 million (58%) were women. In terms of age distribution, about 49% of those not in the labor force were aged 65 years or older. Additionally, 13% were between the ages of 55 and 64, 21% were between the ages of 25 and 54, and the remaining 17% were aged 24 or younger. Intuitively, people aged 65 years and older represented the largest share of individuals who were not in the labor force. Regarding educational attainment, 51% of individuals not in the labor force had a high school diploma or lower. Those with some college education made up 24%, while individuals with a bachelor’s degree or higher accounted for 25%. The racial breakdown of those not in the labor force is as follows: 58.2 million were non-Hispanic white, 15.4 million were Hispanic, 11.7 million were Black, 5.9 million were Asian, and the remaining 2.5 million identified as other races. Main Reason for Not Working The group of people not in the labor force is diverse, and the reasons why individuals are not in the labor force vary widely. In the CPS and ASEC data2, the respondents were asked the main reason for not working. The reasons included: ill or disabled, retired, taking care of home or family, going to school, could not find work and other. In 2023, a total of 93.6 million individuals aged 16 and older neither worked nor looked for work at any time during the year. Among this group, 48.6 million people reported retirement as their main reason for not working. Approximately 14.9 million individuals stated that they were attending school, while 14.7 million cited illness or disability as the main factor. Additionally, 12.7 million people indicated that taking care of home or family was the main reason for not working in 2023. Nearly 1.8 million individuals selected “other reasons,” and roughly 1.0 million cited “could not find work.” Retirement is the main reason for not working for about half of the individuals not in the labor force in 2023. Among those aged 65 years and older, 91% of individuals in this group cited retirement as the main reason for not working. Overall, about 44% of individuals not in the labor force were due to the self-reported reason of retirement and aged 65 years and older. Individuals in this 44% share are unlikely to return to the labor force. While an aging population is a major driver behind the growth of individuals not participating in the labor force, other reasons people give for not engaging in the workforce also play an important role. For individuals aged 16 to 24, the majority cited going to school as the main reason not working in 2023. In other words, for those citing going to school, 87% were between the ages of 16 and 24. Overall, about 14% of the not-in-labor-force population was due to the self-reported reason of going to school and aged 16 to 24. This group is likely to enter the labor force after graduation, although younger individuals will likely replace them in education settings. Prime-age workers, aged 25 to 54, historically represent a larger share of the labor force compared to other age groups. However, men and women in this age group have different reasons for not working in 2023. More than half of women (62%) reported taking care of home or family as the main reason for not working, while 48% of men cited illness or disability as their primary reason. Among prime-age individuals, those with less education were more likely to be out of the labor force than their more educated counterparts. In 2023, 15% of prime-age men with a high school diploma or less were not in the labor force, compared to 10% of those with some college and 5% of those with a bachelor’s degree or higher. The trend was similar among prime-age women, with 33% of those with a high school diploma or less not in the labor force, compared to 20% of those with some college and 13% of those with a bachelor’s degree or more. It is difficult to predict with certainty whether prime-age individuals currently not in the labor force will enter it. However, several factors could encourage individuals to enter or return to the labor market, including improved economic conditions, the availability of remote work, workplace policies, and retraining opportunities. Last, based on the CPS and ASEC data, only a small proportion of the remaining population reported the main reasons for not working were that they could not find work and other reasons. Conclusion These numbers highlight both challenges and opportunities in expanding the labor force to support construction employment. According to the BLS’s monthly job report, approximately 6% of individuals currently not in the labor force and aged 16 to 64 could potentially be recruited into the workforce. Furthermore, the construction labor force is aging. The building industry must recruit the next generation of workers as industry activity grows in the years ahead, given the growth in population not in the labor force. For more information on the CPS Annual Social and Economic Supplement (ASEC), see “Annual Social and Economic Supplements,” U.S. Census Bureau, last revised September 4, 2024, https://www.census.gov/data/datasets/time-series/demo/cps/cps-asec.html.Respondents who reported “no” to the following first three questions were considered to be not in the labor force and a fourth question asked about the main reason for not working: “Did ____work at a job or business at any time during 20__?” “Did ____ do any temporary, part-time, or seasonal work even for a few days in 20__?” “Even though ____did not work in 20__, did ____spend any time trying to find a job or on layoff?” “What was the main reason __did not work in 20?” Ill or disabled Retired Taking care of home or family Going to school Could not find work Other Discover more from Eye On Housing Subscribe to get the latest posts sent to your email.

People Not in the Labor Force2025-03-24T10:17:03-05:00

Volume of Residential Construction Loans Falls in Q4 2024

2025-03-21T08:21:35-05:00

Higher interest rates and tight financial lending conditions have led to a decline in loans for new home construction. The total volume of acquisition, development, and construction (AD&C) loans outstanding from FDIC-insured institutions fell 1.02% to $490.7 billion, the third straight quarterly decline. The level of 1-4 residential construction loans, which include loans for the construction of single-family homes and townhomes, has fallen for seven consecutive quarters. Coincidingly, the volume of 1-4 family residential construction has moved to its lowest level since 2021. The volume of 1-4 family residential construction and land development loans totaled $89.5 billion in the fourth quarter, down 7.6% from one year ago. This is also down after reaching a recent high of $105.0 billion in the first quarter of 2023. To end the year, a plurality of outstanding loans was held by smaller banking institutions, those with $1 billion-$10 billion in total assets, totaling $30.2 billion (33.7%). Banks with $10 billion- $250 billion in assets held the second largest share at $29.8 billion (33.3%), followed by the smallest banks with under $1 billion in assets, holding $20.7 billion (23.1%). The largest banks with over $250 billion in assets held the smallest amount at $8.8 billion (9.8%). Notably, 56.9% of 1-4 family residential construction and development loans were held by banks with under $10 billion in assets to end 2024. Small community banks play a vital role ensuring financial and lending opportunities for builders across the United States. The data below shows the year-ending level of outstanding 1-4 family residential construction loans broken out by bank asset sizes. All Other Real Estate Development Loans Excluding 1-4 family residential construction loans, the level of all other outstanding real estate construction loans totaled $394.6 billion and was down 2.2% from the previous year This is also down from a peak in the second quarter of 2024 of $404.2 billion. The banks that held the most loans were those with total assets between $10-$250 billion totaling $163.2 billion (41.4%) to end 2024. Banks with $1-$10 billion in assets held $107.1 billion (27.3%), banks with more than $250 billion in assets held $86.6 billion (21.9%) and the smallest banks, those with less than $1 billion in assets, held $37.7 billion (9.6%). For the end of 2024, larger banks ($10 billion or more in assets) had more activity in the other construction and land development loan arena compared to 1-4 family residential construction holding 63.3% of the outstanding volume. It is worth noting, the FDIC data represent only the stock of loans, not changes in the underlying flows, so it is an imperfect data source. Nonetheless, lending remains much reduced from years past. The current amount of existing 1-4 family residential AD&C loans now stands 56% lower than the peak level of residential construction lending of $204 billion reached during the first quarter of 2008. Alternative sources of financing, including equity partners, have supplemented this capital market in recent years. Discover more from Eye On Housing Subscribe to get the latest posts sent to your email.

Volume of Residential Construction Loans Falls in Q4 20242025-03-21T08:21:35-05:00

Existing Home Sales Increased in February

2025-03-20T13:17:48-05:00

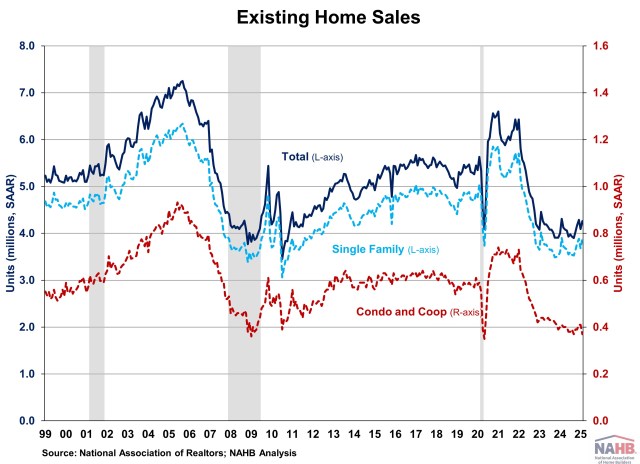
Existing home sales in February increased to the second highest level since March 2024, according to the National Association of Realtors (NAR). This rebound suggests buyers are slowly entering the market as inventory improves and mortgage rates decline from recent high in January. Despite rates easing, economic uncertainty may continue to constrain buyer activity. While existing home inventory improves and the Fed continues lowering rates, the market faces headwinds as mortgage rates are expected to stay above 6% for longer due to an anticipated slower easing pace in 2025. These prolonged rates may continue to discourage homeowners from trading existing mortgages for new ones with higher rates, keeping supply tight and prices elevated. As such, sales are likely to remain limited in the coming months due to elevated mortgage rates and home prices. Total existing home sales, including single-family homes, townhomes, condominiums, and co-ops, rose 4.2% to a seasonally adjusted annual rate of 4.26 million in February. On a year-over-year basis, sales were 1.2% lower than a year ago. The first-time buyer share was 31% in February, up from 28% in January and 26% from a year ago. The existing home inventory level was 1.24 million units in February, up from 1.18 million in January, and up 17.0% from a year ago. At the current sales rate, February unsold inventory sits at a 3.5-months’ supply, unchanged from last month but up from 3.0-months’ supply a year ago. This inventory level remains low compared to balanced market conditions (4.5 to 6 months’ supply) and illustrates the long-run need for more home construction. Homes stayed on the market for an average of 42 days in February, up from 41 days in January and 38 days in February 2024. The February all-cash sales share was 32% of transactions, up from 29% in January but down from 33% a year ago. All-cash buyers are less affected by changes in interest rates. The February median sales price of all existing homes was $398,400, up 3.8% from last year. This marked the 20th consecutive month of year-over-year increases. The median condominium/co-op price in February was up 3.5% from a year ago at $355,100. This rate of price growth will slow as inventory increases. Existing home sales in February were mixed across the four major regions. Sales rose in the South (4.4%) and West (13.3%), fell in the Northeast (-2.0%), and remained unchanged in the Midwest. On a year-over-year basis, sales increased in the Northeast (4.2%) and Midwest (1.0%), decreased in the South (-4.0%), and were unchanged in the West. The Pending Home Sales Index (PHSI) is a forward-looking indicator based on signed contracts. The PHSI fell from 74.0 to an all-time low of 70.6 in January. This decline suggests elevated home prices and higher mortgage rates continue to constrain affordability. On a year-over-year basis, pending sales were 5.2% lower than a year ago, per National Association of Realtors data. Discover more from Eye On Housing Subscribe to get the latest posts sent to your email.
Existing Home Sales Increased in February2025-03-20T13:17:48-05:00

Fed Remains in Wait and See Mode

2025-03-19T16:19:26-05:00

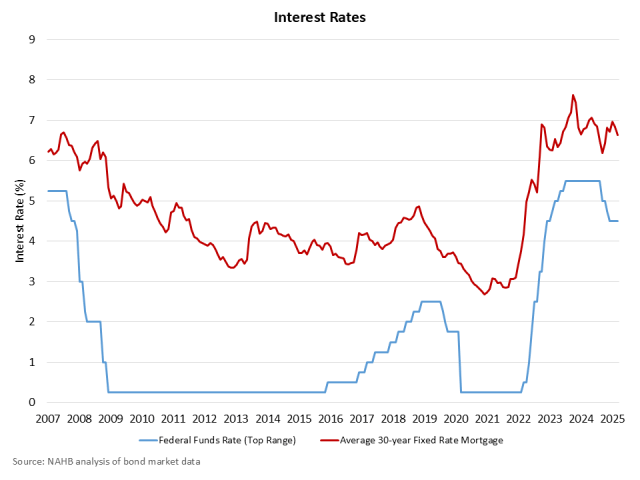
In a widely anticipated move, the Federal Reserve remained on pause with respect to rate cuts at the conclusion of its March meeting, maintaining the federal funds rate in the 4.25% to 4.5% range. While the central bank acknowledged that the economy remains solid, it emphasized a data- and policy-dependent approach to future monetary policy decisions due to increased uncertainty. According to Chair Powell, the Fed “is not in any hurry” to enact policy change and is well positioned to wait to make future interest rate moves. However, in a small dovish step, the Fed slowed the pace of its balance sheet reduction, but only for Treasuries. The Treasury security runoff will be reduced from $25 billion a month to $5 billion. The mortgage-backed security run-off process will remain at a $35 billion a monthly rate. Chair Powell stated that the change was not a signal of broader economic issues and was just a technical adjustment to the long-run goal of balance sheet reduction. Although the Fed did not directly address ongoing trade policy debates (and particularly trade and tariff details expected on April 2) and their economic implications, it reaffirmed that future monetary policy assessments would consider “a wide range of information, including readings on labor market conditions, inflation pressures, and inflation expectations, and financial and international developments.” With respect to prices, the Fed’s March statement noted that “inflation remains somewhat elevated.” For example, the CPI is at a 2.8% year-over-year growth rate. Shelter inflation, while improving as noted by Chair Powell, continues to run at an elevated 4.2% annual growth rate, significantly above the CPI. These costs are driven by challenges such as financing costs, regulatory burdens, rising insurance costs, and the structural housing deficit. The March Fed statement highlighted the central bank’s dual mandate, noting its ongoing assessment of the “balance of risks.”  Crucially, the Fed reiterated its “strong commitment to support maximum employment and returning inflation to its 2 percent objective.” The Fed also published its updated Summary of Economic Projections (SEP). The central bank reduced its GDP outlook for 2025 from 2.1% growth to just 1.7% (measured as percentage change from the fourth quarter of the prior year to the fourth quarter of the year indicated). Policy uncertainly likely played a role for this adjustment. The Fed made only marginal changes to its forecast for unemployment, pointing to a 4.3% jobless rate for the fourth quarter of 2025. The Fed did lift its inflation outlook, increasing its forecast for Core PCE inflation from 2.5% for the year to 2.8%. Forecasters, including NAHB, have lifted inflation estimates for 2025 due to tariffs, although tariffs may only produce a one-off shift in the price level rather than a permanent increase for the inflation rate. Nonetheless, Chair Powell noted that tariffs have already affected inflation forecasts for 2025. The Fed’s SEP also indicated that the Fed may cut twice this year, placing the federal funds rate below 4% during the fourth quarter of 2025. However, those FOMC members who saw less than two rate cuts this year were more likely to forecast no rate cuts at all for 2025. Looking over the long run, the SEP projections suggest that the terminal rate for the federal funds rate will be 3%, implying six total twenty-five basis point cuts in the future as rates normalize. This is lower than our forecast, which suggests a higher long-run inflation risk path and a terminal rate near 3.5%. A lower federal funds rate means lower AD&C loan rates for builders, which can help with housing supply and hold back shelter inflation. Discover more from Eye On Housing Subscribe to get the latest posts sent to your email.
Fed Remains in Wait and See Mode2025-03-19T16:19:26-05:00

U.S. Sawmill Production Capacity Constant in 2024

2025-03-19T10:18:35-05:00

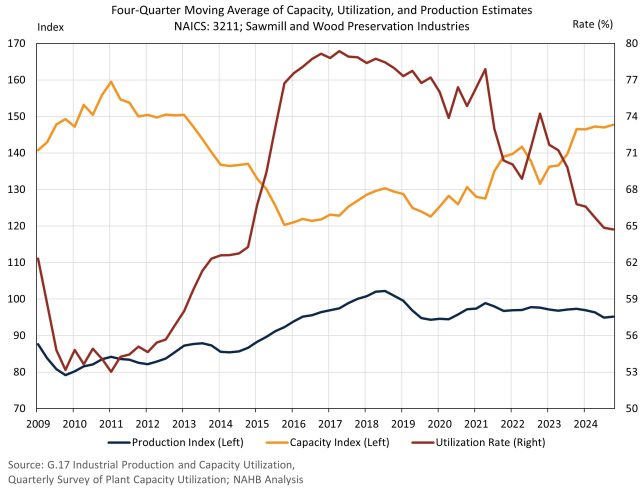
Sawmill and wood preservation firms reported lower capacity utilization rates coupled with level production and capacity throughout 2024. Despite no growth in production in 2024, utilization rates have trended downwards since 2017 as sawmills have expanded production capability. Even with more production capability, real output has not followed as output remains lower than 2018. Capacity utilization rates are a ratio of actual production and potential production capabilities for firms. The utilization rate for sawmills and wood preservations firms was 64.7% in the fourth quarter on a four-quarter moving average basis. As utilization rates have shifted lower, the gap between full production capability and actual production has grown. Actual production is typically lower than full capability due to multiple factors ranging from insufficient materials and orders to lack of labor. By combining the Federal Reserve’s production index and the Census Bureau’s utilization rate, we can compose a rough index estimate of what the current production capacity is for U.S. sawmills and wood preservation firms. Shown below is a quarterly estimate of the production capacity index. This capacity index measures the real output if all firms were operating at their full capacity. Based on the data above, sawmill production capacity has increased from 2015 but remains lower than peak levels in 2011. Most of the recent capacity gains took place between 2023 and 2024, followed by little gain over the course of 2024. As evident above, there is ample room to increase production of domestic lumber, but current production levels remain much unchanged over the past several years. Employment is an important factor for ensuring firms reach their full capacity. For sawmill and wood preservation firms, the number of employees declined to its lowest level since 2021, reporting an average of just over 89,000 employees across the industry in the fourth quarter. Employment declines, likely due to a weak lumber market in 2024, help explain why utilization rates have fallen. With fewer workers, it is less likely that a firm can increase production to its full capability. Imports Since U.S. firms do not produce at their full potential, imports help to supplement domestic supply, especially in the softwood lumber market. According to Census international trade data, existing tariffs on Canadian softwood lumber have not reduced the need for imports to meet domestic consumption but have made the U.S. more reliant on non-North American lumber, resulting in unnecessarily complex supply chains. The current AD/CVD Canadian softwood lumber tariff rate stands at 14.5% and is expected to double under the administrative review process by the Department of Commerce. Potential tariffs on lumber, such as the ongoing 232 investigation and 25% on all Canadian goods, could push tariffs rates on Canadian softwood lumber above 50% later this year. Higher tariffs on softwood lumber mean higher costs for builders who use lumber as a key input to construction. Given the current housing unaffordability crisis, any additional costs will continue push homeownership and affordable housing further out of reach for households in the U.S. Discover more from Eye On Housing Subscribe to get the latest posts sent to your email.
U.S. Sawmill Production Capacity Constant in 20242025-03-19T10:18:35-05:00

About My Work

Phasellus non ante ac dui sagittis volutpat. Curabitur a quam nisl. Nam est elit, congue et quam id, laoreet consequat erat. Aenean porta placerat efficitur. Vestibulum et dictum massa, ac finibus turpis.

Recent Works

Recent Posts