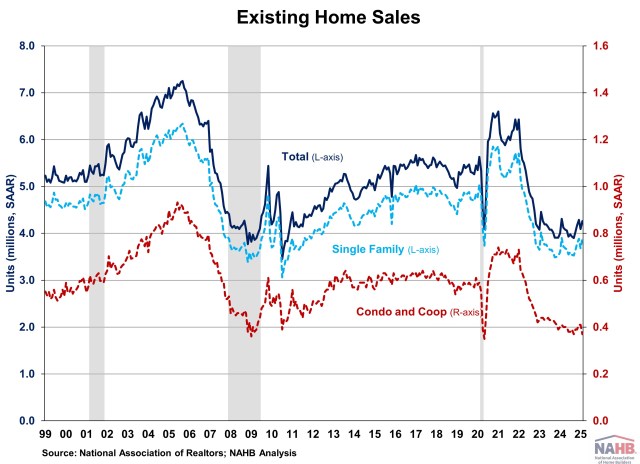
Existing Home Sales Edge Higher in May
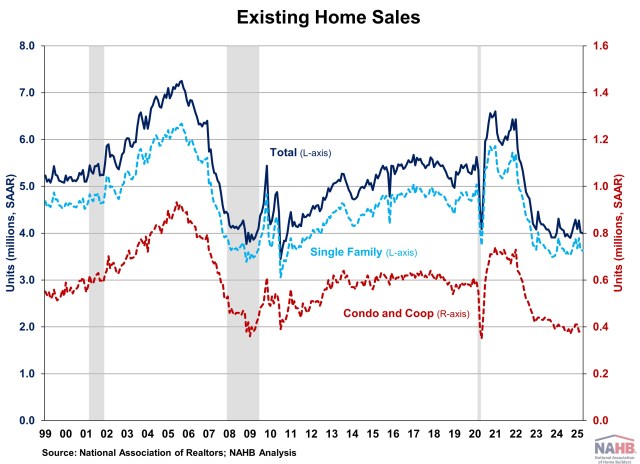
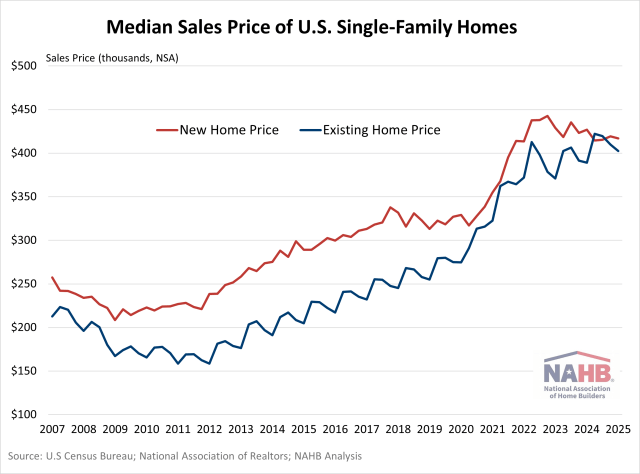
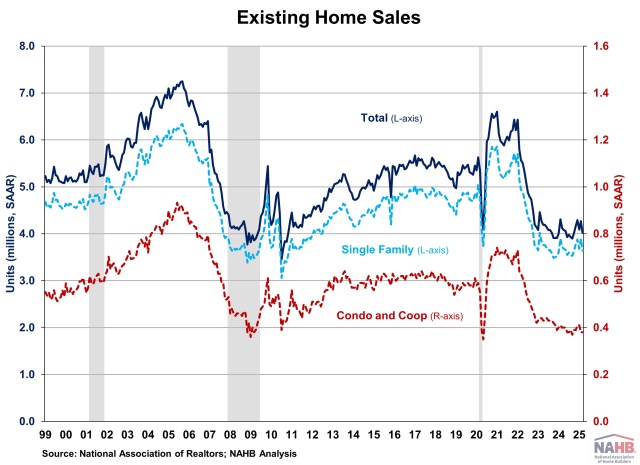
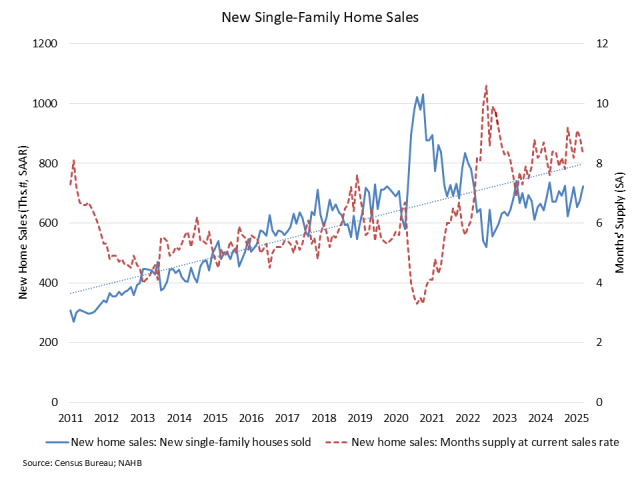
Fan-Yu Kuo2025-06-23T13:17:33-05:00Existing home sales rose 0.8% in May but remained near historical lows, according to the National Association of Realtors (NAR). Despite the modest increase, this marks the slowest pace for May since 2009. The sluggish sales suggest higher mortgage rates and elevated home prices continue to sideline buyers even with improved inventory conditions. Mortgage rates have hovered between 6.5% and 7% due to ongoing economic and tariff uncertainty this year, prompting the Fed to pause interest rate cuts. With mortgage rates expected to stay above 6% for longer due to an anticipated slower easing pace in 2025, these prolonged higher rates and high home prices would continue to weigh on the market. As such, sales are likely to remain limited in the coming months. Total existing home sales, including single-family homes, townhomes, condominiums, and co-ops, rose 0.8% to a seasonally adjusted annual rate of 4.03 million in May. On a year-over-year basis, sales were 0.7% lower than a year ago. The first-time buyer share was 30% in May, down from 34% in April and 31% from a year ago. The existing home inventory level was 1.54 million units in May, up 6.2% from April, and up 20.3% from a year ago. At the current sales rate, May unsold inventory sits at a 4.6-months’ supply, up from 4.4-months in April and 3.8-months in May 2024. Inventory between 4.5 to 6 month’s supply is generally considered a balanced market. Homes stayed on the market for an average of 27 days in May, down from 29 days in April but up from 24 days in May 2024. The May all-cash sales share was 27% of transactions, up from 25% in April but down from 28% a year ago. All-cash buyers are less affected by changes in interest rates. The May median sales price of all existing homes was $422,800, up 1.3% from last year. This marked an all-time high for the month of May and the 23rd consecutive month of year-over-year increases. The median condominium/co-op price in May was up 0.7% from a year ago at $371,300. Recent gains for home inventory will put downward pressure on resale home prices in most markets in 2025. Geographically, three of the four regions saw an increase in existing home sales in May, with an increase of 1.7% in the South, 1.0% in the Midwest, and 4.2% in the Northeast. Meanwhile, sales in the West fell 5.4%. On a year-over-year basis, sales were up in the Northeast (4.2%) and the Midwest (1.0%), while sales were down in the South (-0.5%) and the West (-6.7%). The Pending Home Sales Index (PHSI) is a forward-looking indicator based on signed contracts. The PHSI fell from 76.1 to 71.3 in April, suggesting buyers remained constrained by higher mortgage rates. On a year-over-year basis, pending sales were 2.5% lower than a year ago, per National Association of Realtors data. Discover more from Eye On Housing Subscribe to get the latest posts sent to your email.