2025 First Quarter State-Level GDP Data
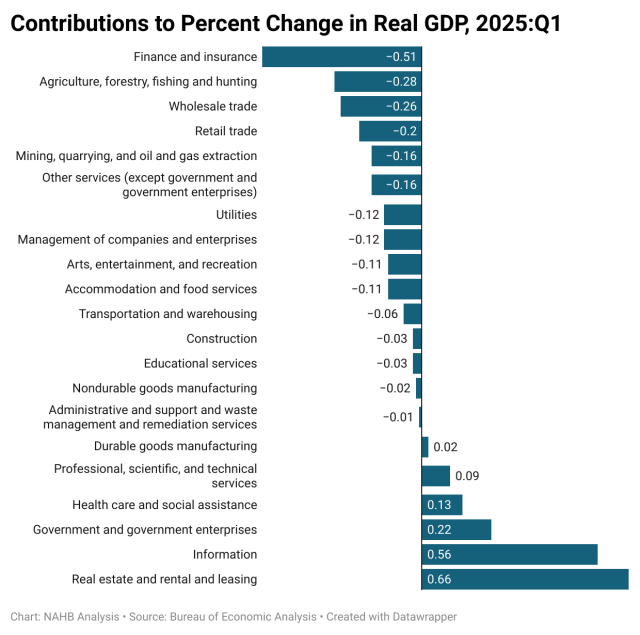
Danushka Nanayakkara-Skillington2025-06-27T14:15:30-05:00Real gross domestic product (GDP) increased in ten states in the first quarter of 2025 compared to the last quarter of 2024, according to the U.S. Bureau of Economic Analysis (BEA). Thirty-nine states reported real GDP declines, while the District of Columbia and Delaware reported no change during this time. The percent change in real GDP ranged from a 1.7 percent increase at an annual rate in South Carolina to a 6.1 percent decline in Iowa and Nebraska. Nationwide, growth in real GDP (measured on a seasonally adjusted annual rate basis) declined 0.5 percent in the first quarter of 2025. This is the first decline in quarterly real GDP levels in three years. The leading contributors to the decrease in real GDP across the country were finance and insurance; agriculture, forestry, fishing and hunting; and wholesale trade. Regionally, real GDP growth declined in seven out of the eight regions between the last quarter of 2024 and the first quarter of 2025. The Southeast region was the only territory to post a meager 0.3 percent increase. The percent change in real GDP declines ranged from a 0.3 percent decline in the Southwest and Far West regions, to a 3.3 percent decline in the Plains region. At the state level, South Carolina posted the highest GDP growth rate (1.7 percent), followed by Florida (1.4 percent) and Alabama (1.0 percent). The percent increase in real GDP ranged from a 1.7 percent increase in South Carolina to a 0.1 percent increase in Georgia. On the other hand, 39 states reported real GDP declines ranging from a 0.1 percent decline in New Hampshire, Ohio, and Texas, to a 6.1 percent decline in Iowa and Nebraska for the first quarter of 2025. Looking at industry contributions to GDP across states, the “real estate and rental and leasing industry” was the leading contributor to growth in all 50 states and the District of Columbia. In contrast, the agriculture, forestry, fishing, and hunting industry led a decrease in 39 states, and was the leading contributor to economic contraction in 11 states. Discover more from Eye On Housing Subscribe to get the latest posts sent to your email.