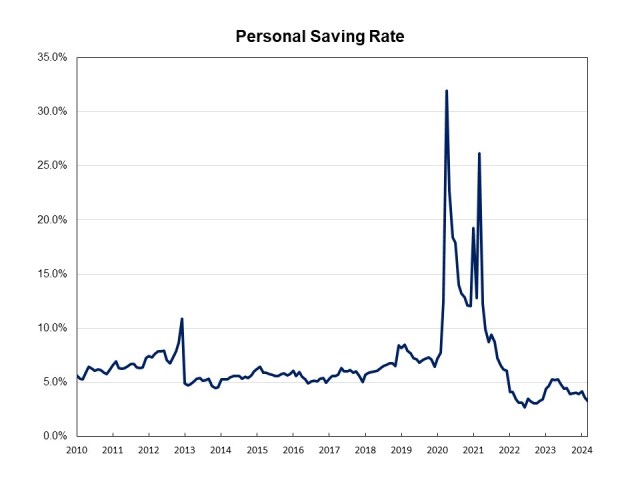
Personal Saving Rate Falls to 3.2% in March
Na Zhao2024-04-26T12:21:12-05:00The most recent data release from the Bureau of Economic Analysis (BEA) showed that personal income increased 0.5% in March, up from a 0.3% increase in the prior month. Gains in personal income are largely driven by increases in wages and salaries. As spending outpaced personal income growth, the March personal savings rate dipped to 3.2%. This is 0.4 percentage points lower than the February reading and down by nearly two percentage points from last year. As inflation has almost eliminated compensation gains, people are dipping into savings to support spending. This will ultimately lead to a slowing of consumer spending. Real disposable income, income remaining after adjusted for taxes and inflation, edged up 0.2% in March, up from a dip of 0.1% in February. On a year-over-year basis, real (inflation adjusted) disposable income rose 1.4%. The pace of real personal income growth slowed after reaching 5.3% year-over-year gain in June of 2023. Personal consumption expenditures (PCE) rose 0.8% in March after a 0.8% increase in February. Real spending, adjusted to remove inflation, increased 0.5% in March, with spending on goods rising 1.1% and spending on services up 0.2%. Discover more from Eye On Housing Subscribe to get the latest posts to your email.