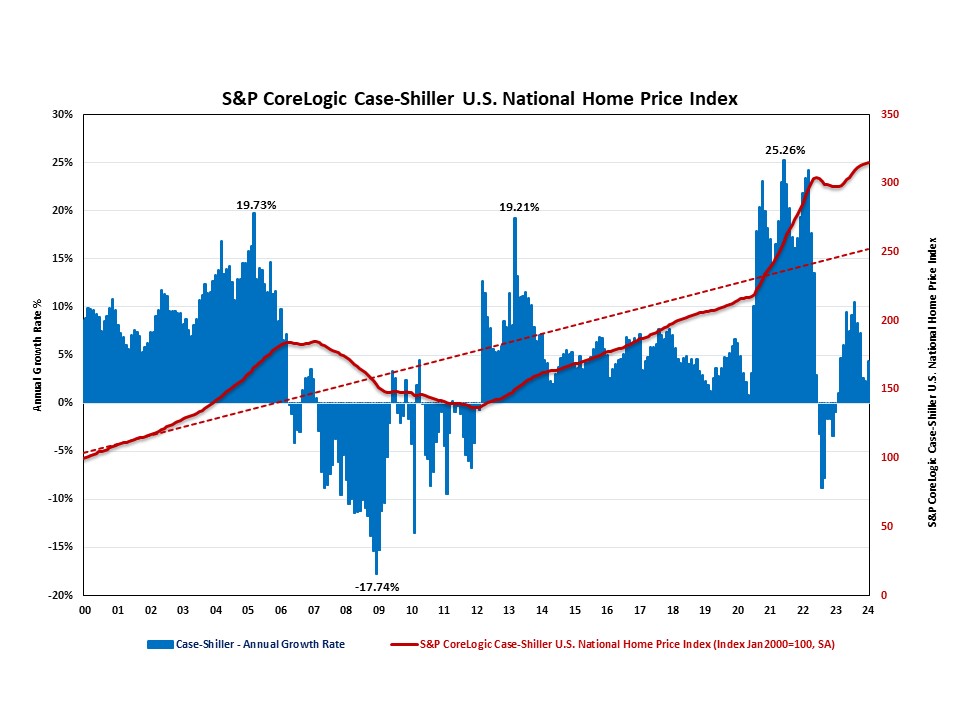
Home Prices Increase for January
The S&P CoreLogic Case-Shiller U.S. National Home Price Index (HPI), reported by S&P Dow Jones Indices, rose at a seasonally adjusted rate of 4.36%. Although this rate has been slowing the previous four months, January saw its first uptick from 2.32% in December 2023.
On a year-over-year basis, the S&P CoreLogic Case-Shiller U.S. National Home Price NSA Index posted a 6.03% annual gain in January, following a 5.57% increase in December. The year-over-year rate has been increasing since May of 2023, and is at its highest since December of 2022.
Meanwhile, the Home Price Index released by the Federal Housing Finance Agency (FHFA), declined at a seasonally adjusted annual rate of -0.86% in January, following a 1.1% increase in December. On a year-over-year basis, the FHFA Home Price NSA Index rose 6.33% in January, down from 6.63% in the previous month.
In addition to tracking national home price changes, S&P Dow Jones Indices also reported home price indexes across 20 metro areas in January on a seasonally adjusted basis. While seven out of 20 metro areas reported negative home price appreciation, 13 metro areas had positive home price appreciation. Their annual growth rates ranged from -5.53% to 18.80%. Among all 20 metro areas, only four metro areas exceeded the national average of 4.36%. San Diego has the highest rate at 18.80%, followed by Washington, DC at 10.74%, and Charlotte with a 6.46% increase. The six metro areas that experienced price declines were Denver (-5.53%), Phoenix (-4.16%), Cleveland (-1.74%), Seattle (-1.47%), Portland (-1.37%), Detroit (-1.04%), and Miami (-.25%).