Most Home Builders are Small Businesses
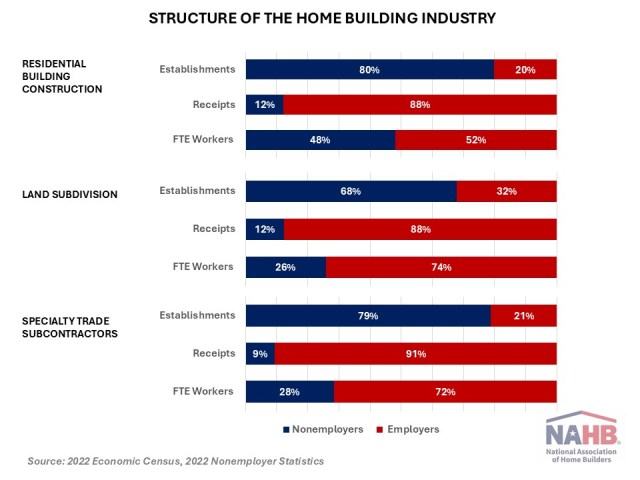
Web Master2025-08-27T08:27:22-05:00Despite historically low self-employment rates and the rising market share of top ten builders, residential construction remains an industry dominated by independent entrepreneurs, with nearly 80% of home builders and specialty trade contractor firms being self-employed independent contractors. Even among firms with paid employees, the industry continues to be dominated by small businesses, with 63% of homebuilders and two out of three specialty trade contractors generating less than one million dollars in total business receipts. The new estimates are based on the 2022 Economic Census and Nonemployer Statistics data.1The Economic Census covers several construction subsectors that comprise the home building industry: Residential Building Construction (RBC) – Single-family general contractors (except for-sale builders) – Multifamily general contractors (except for-sale builders) – New housing for-sale builders Residential Remodelers Land Subdivision (or land developers) Specialty Trade Contractors (STC) The 2022 statistics show that the majority of residential construction businesses are self-employed independent contractors. There are over 813,000 nonemployer firms in residential building construction (RBC), accounting for close to 80% of all establishments. In land subdivision, more than 9,000 independent contractors account for 68% of land subdivision firms. Over 1.9 million specialty trade independent contractors make up 79% of all STC establishments. These nonemployer firms also account for almost half of the full-time employees (FTE) in residential building construction, 26% in land subdivision, and 28% in STC. Most of these self-employed mom-and-pop firms are very small, with annual receipts averaging under $103,000 for residential building construction, and under $70,000 for specialty trade contractors. Self-employed independent contractors in land subdivision average around $288,000 in annual business receipts. As a result, these nonemployer firms make up only 12% of all sales and receipts generated by residential building construction and land subdivision, and 9% of specialty trade contractors’ revenue. Among residential construction businesses with paid employees, remodeling, land subdivision, and specialty trade subcontractors (STC) companies tend to be smaller. Three out of four remodeling establishments, 63% of land developers, and 59% of STC companies generate under $1 million in receipts. Home builders are typically somewhat larger, with about 45% of companies reporting annual sales over $1 million. Among homebuilders, multifamily general contractors tend to be the largest. However, the Census Bureau did not disclose the number of the largest (with revenue over $100 million) and smallest (with revenue under $100K) multifamily and single-family custom builders in 2022. As a result, the revenue spectrum for MF and SF contractors is incomplete and is presented in a separate chart. Multifamily contractors are typically larger compared to single-family contractors and for-sale builders (who build on land they own and control). Ten percent of multifamily contractors reported annual sales between $10 million and 25 million, and an additional 11% earned between $25 million and $100 million in 2022. Under the most recent U.S. Small Business Administration (SBA) size standards, the vast majority of residential construction companies qualify as small businesses. The most recent small business size limits for all types of builders are $45 million, $34 million for land subdivision, and $19 million for specialty trade contractors. By these standards, almost all remodelers and single-family contractors, and at least 98% of land developers, and 96% of specialty trade contractors, easily qualify as small businesses. The Economic Census, like many other federal statistics programs, collects data only on establishments with payroll employees. The Nonemployer Statistics Program by the Census Bureau collects annual data for businesses that have no paid employees, including the number of businesses and total receipts by industry, which largely come from the IRS. Discover more from Eye On Housing Subscribe to get the latest posts sent to your email.

