August Private Residential Construction Spending Edges Higer
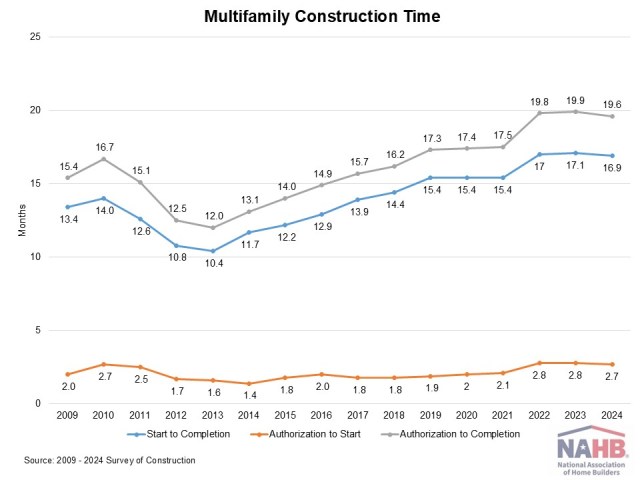
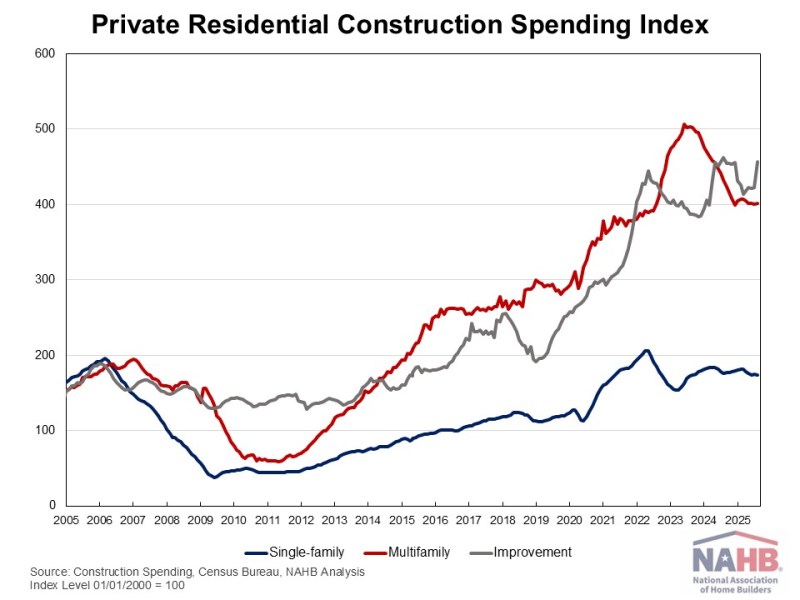
Web Master2025-11-17T11:14:28-06:00Private residential construction spending inched up 0.8% in August, continuing steady growth since June 2025. This modest increase was primarily driven by more spending on multifamily construction and home improvements. However, total spending was 2% lower than a year ago, as the housing sector continues to navigate the economic uncertainty stemming from ongoing tariff concerns and elevated mortgage rates. According to the latest U.S. Census construction spending data, single-family construction spending slipped 0.4% in August, in line with the soft builder sentiment reflected in the August NAHB/Wells Fargo Housing Market Index (HMI). Compared to a year ago, single-family construction spending decreased by 1.1%. Improvement spending (remodeling) posted a solid 8.2% gain for the month, but it remained 1.3% lower than in August 2024. The remodeling sector continues to show resilience, supported by strong homeowner equity and persistent demand for home improvements. Meanwhile, multifamily construction spending rose 0.2% in August, marking a pause in the downward trend that began in mid-2023. Compared to a year earlier, multifamily spending was down 7.1%. The NAHB construction spending index is shown in the graph below. The index illustrates how spending on single-family construction has slowed since early 2024 under the pressure of elevated interest rates and concerns over building material tariffs. Multifamily construction spending growth has also slowed down after the peak in July 2023. Improvement spending has also been weakening since the beginning of 2025. Spending on private nonresidential construction was down 4% over a year ago. The annual private nonresidential spending decrease was primarily driven by a $20 billion drop in manufacturing construction spending, followed by a $11 billion decrease in commercial construction spending.