Where are Porches Most Common for Newly-Built Homes?
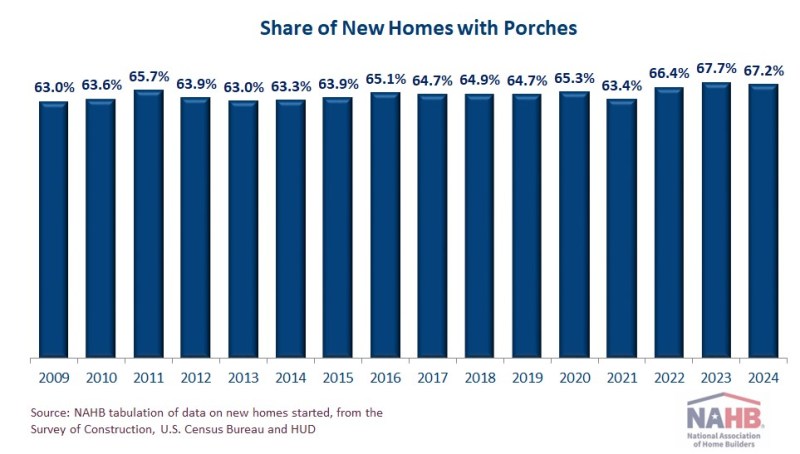
Web Master2025-10-22T11:16:10-05:00Although the share of new homes with porches edged down in 2024, porches continue to rank as the most common outdoor feature on new homes, according to NAHB tabulation of the latest data from the Survey of Construction (SOC, conducted by the U.S. Census Bureau with partial funding from HUD). Of the roughly 1.0 million single-family homes started in 2024, the SOC data show that 67.2% were built with porches. This is down, but only slightly, from the all-time peak of 67.7% reported a year earlier. Porches also continue to be more common on new homes than the other outdoor features covered in the SOC: patios and, especially, decks. Traditionally, porches on new homes have been most common in the four states that make up the East South Central Census division. That was true again in 2024, although only by a narrow margin. In 2024, 81% of new homes in the East South Central had porches, but this share was well over 70% in three other divisions: the Pacific (78%), Mountain (77%), and South Atlantic (74%) divisions. Compared to the 2023 numbers reported in last year’s post, the porch percentages were up by two points in the East and West South Central divisions, unchanged in the Mountain and South Atlantic divisions, and down at least slightly in the other five divisions. Detail about the characteristics of porches on new homes is available from the Builder Practices Survey (BPS), conducted annually by Home Innovation Research Labs. Among other things, the 2025 BPS report (based on homes built in 2024) shows that porches continue to be far more common on the front of new single-family homes than on the side or rear. When on the front, porches average approximately 100 square feet of floor area. The other categories of porches distinguished in the SOC, although comparatively rare, tend to be noticeably larger: 140 square feet for a side or rear porch, and just over 200 square feet for a screened-in porch. On a square foot basis, builders continue to use concrete more than any other material to build new-home porches. Only one division remains a clear outlier in this regard. In New England, builders seldom use concrete in new-home porches, instead most often building them out of composite (a blend of usually recycled wood fibers and plastic). In that division, they also use treated wood, PVC or other plastics, cedar, and natural stone more often than concrete. Discover more from Eye On Housing Subscribe to get the latest posts sent to your email.