Supply-Side Cost Pressures Drove Housing as Inflation Leader in 2024
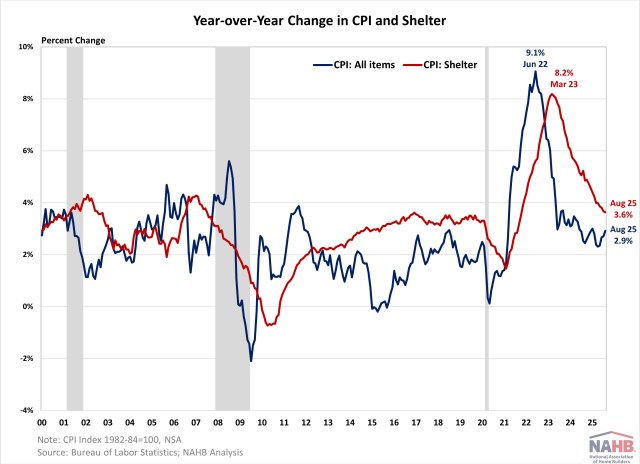
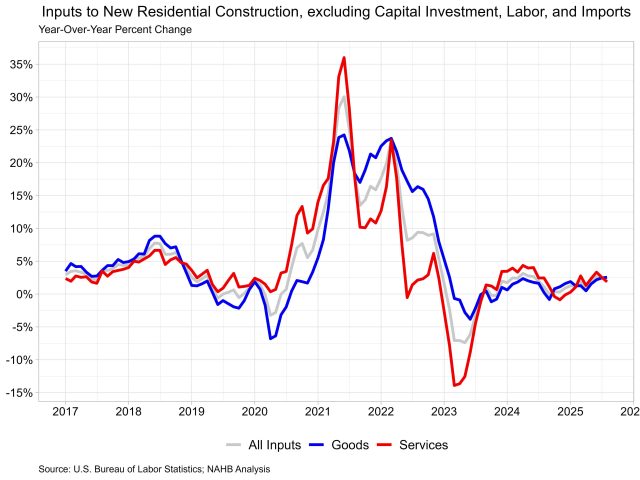
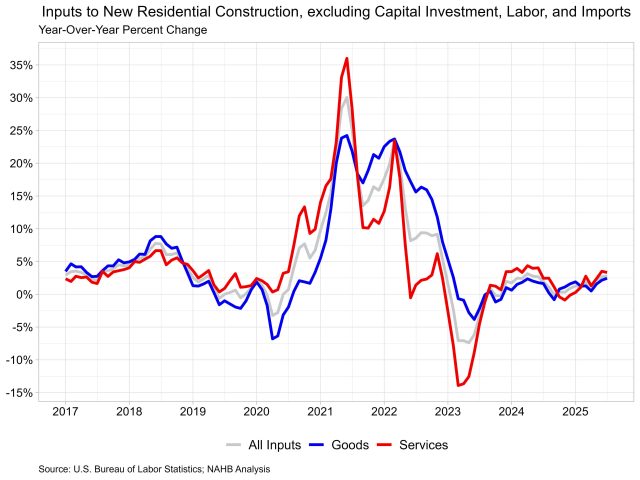
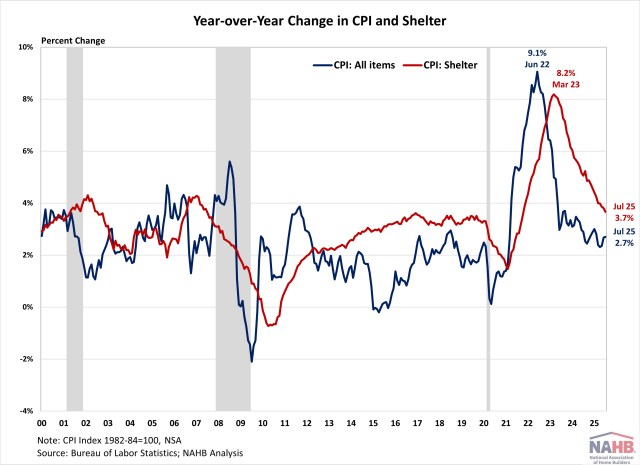
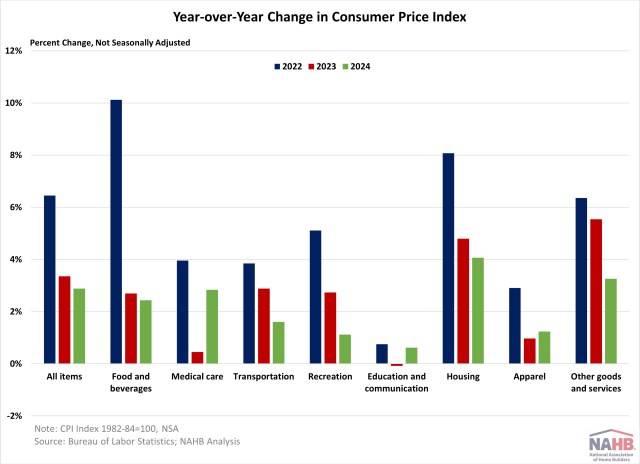
Web Master2025-10-03T09:20:31-05:00Though the rate of inflation peaked in June 2022, consumer prices continued to increase throughout 2023 and 2024 as inflation drove further price growth, according to 2024 CPI review from the Bureau of Labor Statistics. Nonetheless, the rate of inflation slowed from 3.4% in 2023 to 2.9% in 2024. All major categories experienced price increases in 2024, though only three out of eight accelerated, including medical care, education and communication, and apparel. While all spending categories contributed to price growth in 2024, housing was the key driver of inflation, accounting for 63.5% of the total CPI increase in 2024. The housing category includes three main components: shelter (rent and owner’s equivalent rent), fuels and utilities, and household furnishings and operations. After peaking at an 8.2% growth rate in January 2023, housing inflation has eased from 4.8% in 2023 to 4.1% in 2024. The shelter component represents about 80% of total housing costs. Shelter inflation has moderated from 6.2% to 4.6% between 2023 and 2024. Despite this deceleration, shelter still accounted for 36.7% of consumer spending in the CPI and contributed approximately 58% of total inflation in 2024. This suggests persistent shelter inflation was the major reason that kept inflation elevated above the Fed’s 2% target. While the Fed rate cuts could ease some housing market pressure, the central bank’s ability to address rising housing costs is limited. Shelter inflation is driven by a lack of affordable supply and rising construction costs. Tight monetary policy hurts housing supply by increasing financing cost. Higher mortgage rates and elevated home prices also price out potential homebuyers, driving up rental demand and worsening the housing affordability. This can be seen on the graph below, even as mortgage rates surged from 3% to 7%, shelter inflation continued to rise despite Fed policy tightening. Additional housing supply is the primary solution to ease housing inflation and overall inflation. This suggests construction costs, including building materials, matter not just for housing but also for overall inflation and future monetary policy. Discover more from Eye On Housing Subscribe to get the latest posts sent to your email.