House Price Appreciation by State and Metro Area: Third Quarter 2025
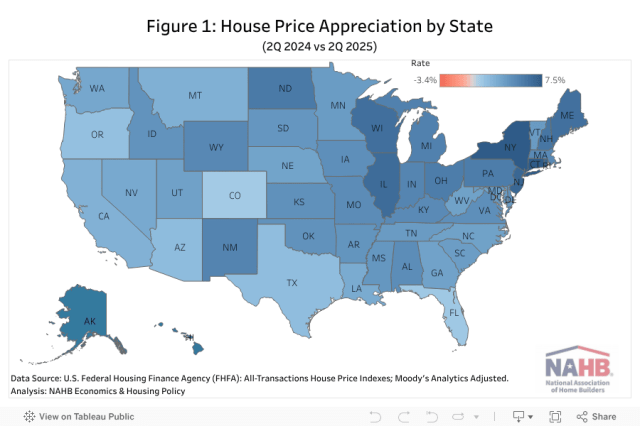
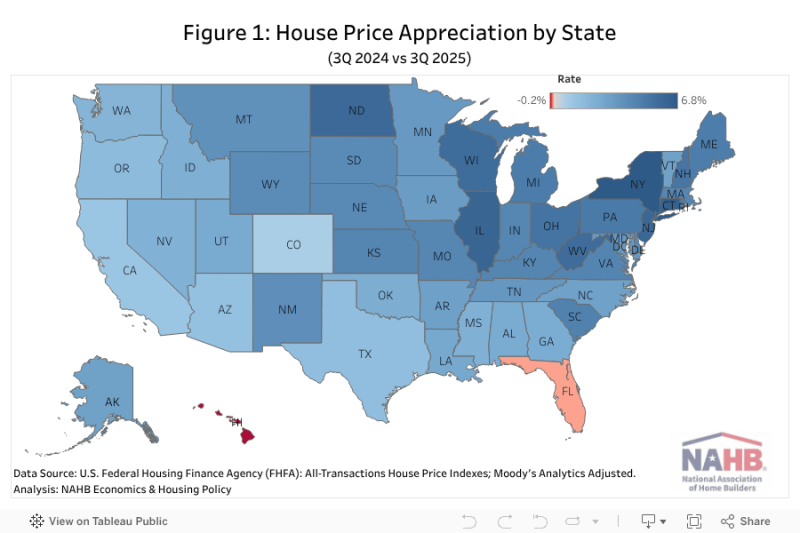
Web Master2025-12-03T11:16:53-06:00House prices continued to rise in the third quarter of 2025, though the pace of growth slowed as elevated mortgage rates, affordability challenges, and persistent economic uncertainty weighed on consumer demand. After several years of rapid growth, Hawaii and 38 metro areas saw house price declines this quarter, highlighting significant regional variations in market conditions. Nationally, according to the quarterly all-transactions House Price Index (HPI) released by the Federal Housing Finance Agency (FHFA), U.S. house prices rose 3.3% in the third quarter of 2025, compared to the same period in 2024. This represents the slowest year-over-year price appreciation since 2013, indicating a cooling in the housing market following a decade of robust price growth. The FHFA’s all-transactions HPI tracks average price changes based on repeat sales and refinancings of the same single-family properties. It offers insights not only at the national level but also across states and metropolitan areas. Between the third quarter of 2024 and the third quarter of 2025, 48 states and the District of Columbia experienced positive year-over-year (YoY) house price appreciation, with gains ranging from 0.6% to 6.8%. Hawaii was the only state to record a decline, while Florida posted no growth. New York led all states with a 6.8% gain, followed by Connecticut with a 6.5% gain and Illinois with a 6.2% gain. On the opposite end, Colorado posted the lowest house price appreciation at 0.6%. Notably, out of all 50 states and the District of Columbia, 29 states exceeded the national YoY growth rate of 3.3%. However, on a quarterly basis, home price appreciation decelerated in 45 states compared to the second quarter of 2025, highlighting a broad-based deceleration in the housing market. House price growth also varied widely across U.S. metro areas, ranging from a 7.8% decline to a 16.0% increase year-over-year. Punta Gorda, FL recorded the steepest drop, while Farmington, NM posted the strongest gains over the previous four quarters. In the third quarter of 2025, 34 metro areas, in reddish color on the map above, experienced negative house price growth, while 351 metro areas posted increases. Since the onset of the COVID-19 pandemic, house prices have surged nationally. Between the first quarter of 2020 and the third quarter of 2025, house prices climbed 54.9% nationwide, with more than half of metro areas exceeding this rate. However, 226 metro areas have seen varying degrees of decline from their post-COVID peaks, ranging from -0.1% to -12.7%. The map below presents the top ten and bottom ten markets for house price appreciation over the past five years. Among all the metro areas, house price appreciation ranged from 18.3% to 88.4%. Knoxville, TN topped the list with the highest house price appreciation, while Odessa, TX posted the lowest appreciation, ending Lake Charles, LA’s five-quarter run at the bottom.