Better Growth, Larger Deficits: CBO Fiscal Outlook
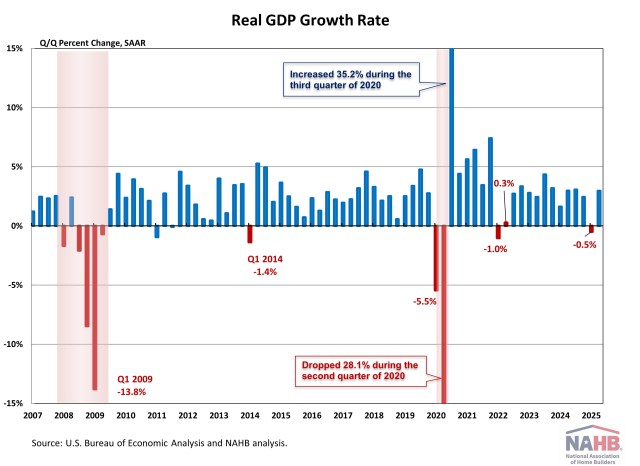
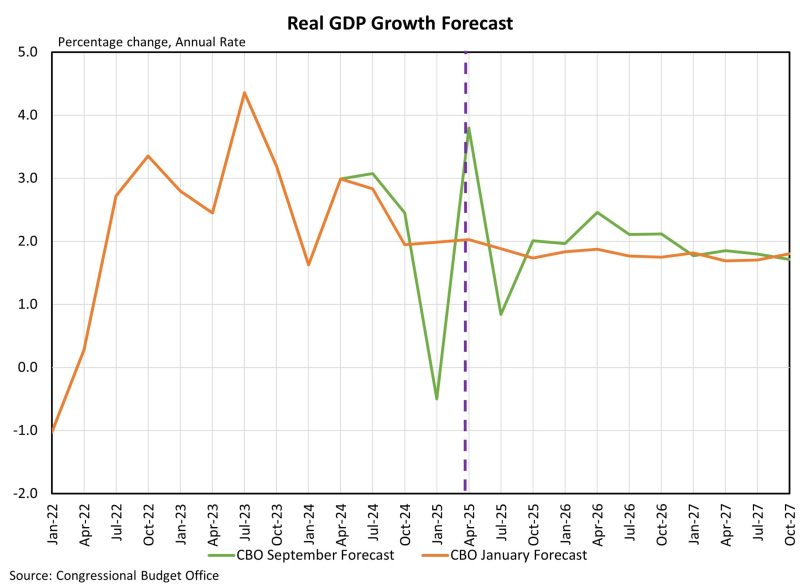
Web Master2025-10-17T08:16:14-05:00The Congressional Budget Office (CBO) is a key nonpartisan score keeper that measures the effects of policy changes by the Federal Government. With several policy changes since January of this year, including the One Big Beautiful Bill Act (OBBBA), stricter immigration, and higher tariffs, the CBO updated its economic projections through 2028. Primarily, the CBO forecasts higher growth in the coming year with higher deficits also around the corner. The updated CBO view of the economy projects lower GDP growth in 2025 due to negative effects of tariffs. However, this is followed by stronger growth in 2026 as supply chains adjusted to tariffs and the OBBBA boosts consumption and private investment. More growth is forecasted for 2027 and 2028 as the economy adjusts to lower net immigration but is partially offset by higher domestic production because of tariff protection. In the CBO’s analysis: At the end of 2028, the level of real GDP is about 0.1 percent higher than it was in CBO’s January 2025 projections because of the economic effects of the reconciliation act, higher tariffs, and lower net immigration; the effects of interactions among those factors; and adjustments to reflect recently published data. CBO Real GDP Growth Real GDP grew at an annualized rate of 3.8% in the second quarter of 2025, well above the decline of 0.5% estimated in the first quarter of this year. Per the CBO’s revised forecast, the largest increase in the quarterly growth forecast is in the second quarter of 2026. Real GDP growth was previously forecasted at 1.8% but is now forecasted at 2.5%, a 0.7 percentage point increase. The increases in GDP growth are a result of higher household after-tax income (boosts personal consumption), favorable treatment of private investment, and higher Federal Government spending on border security. All these factors boost overall demand, which in turn creates the risk of higher inflation. In the CBO’s assessment, this results in the Federal Reserve lowering interest rates at a slower pace than it might have otherwise done. The CBO GDP growth forecasts for 2027 and 2028 are essentially unchanged from the previous January forecast. On the residential construction front, 2025 has so far been a slower year than expected. In January, the CBO forecasted real residential fixed investment (RFI) to grow above 5% through the start of 2027 with the expectation that interest rates would fall faster, and pent-up demand coupled with a limited supply of existing homes for sale would boost new construction. Instead for 2025, interest rates have in fact remained higher for longer and put a damper on housing construction. RFI has negatively contributed to GDP for the first two quarters of 2025 and contracted 1.3% and 4.7% in the first and second quarters. The CBO’s forecasts show declines in RFI as home building starts entering 2026. The September forecasts are well below previous levels, with none forecasted above 3.0% until the first quarter of 2028. Federal Government Fiscal Outlook While the economy is expected to grow faster under the passage of OBBBA, the Federal Government’s fiscal outlook did not improve. The CBO’s original deficit outlook assumed that the 2017 tax policy changes would expire, leaving many taxpayers facing higher tax payments in 2026 but also reducing the level of annual federal deficits. With the passage of the OBBBA, which continued many of the policies of Tax Cuts and Jobs Act of 2017 and established some new tax policy, annual deficit totals are a total of $3.4 trillion larger over the ten-year budget window than in the prior CBO outlook. Deficits are larger each year after 2025 but more pronounced in years leading up to 2028 as some provisions expire in the years following. The deficit is expected to be smaller by $21.1 billion in 2025 and peak at $602.4 billion larger in 2027. For housing stakeholders, long-term fiscal deficits risk higher inflation and therefore higher interest rates. More government debt means more expensive mortgages and therefore more challenging housing affordability conditions. Discover more from Eye On Housing Subscribe to get the latest posts sent to your email.