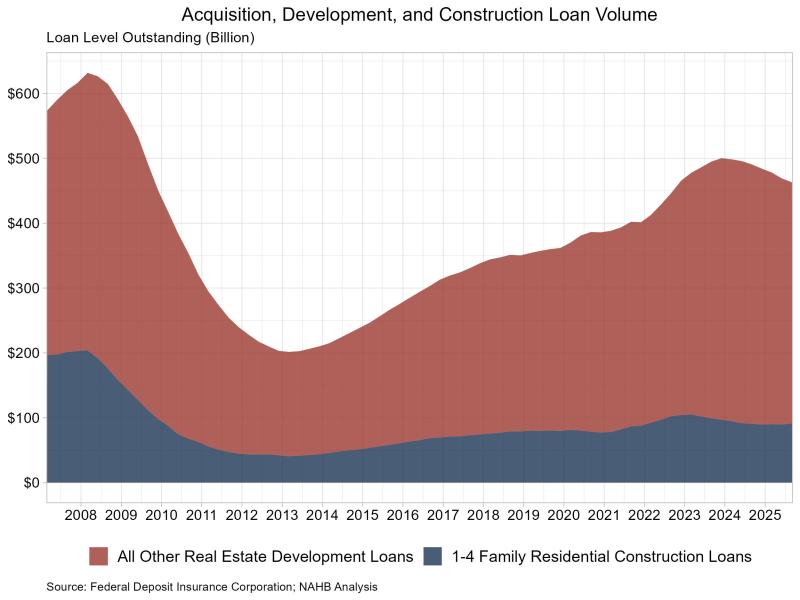
The Fed Cuts amid Partly Cloudy Conditions

2025-10-29T14:19:05-05:00

With the government shutdown limiting the quantity of economic data available to markets and policymakers, the central bank’s Federal Open Market Committee (FOMC) enacted a widely anticipated 25 basis point cut for the short-term federal funds rate. This marks the second consecutive cut this Fall, and the move decreases the policy rate to an upper rate of 4.25%. Reflecting that the market anticipated this policy move, long-term rates were relatively unchanged after the FOMC announcement. There were two dissenters to today’s decision, with new Fed Governor Miran voting no (preferring a larger 50 basis point reduction). Kansas City Fed President Schmid also voted no, but wanted no federal funds rate reduction. Chair Powell noted that there were “strongly differing” views at this meeting with respect to December policy action, with a possibility of no further cuts before the end of the year. Commenting on current economic conditions, the FOMC statement noted that “economic activity has been expanding at a moderate pace.” In his press conference, Chair Powell noted that activity in the housing market remains “weak.” As a justification for monetary policy easing, the FOMC stated that “job gains have slowed this year.” On the other side of the policy mandate, the Fed specified that “inflation has moved up since earlier in the year and remains somewhat elevated.” In a nod to some short-term liquidity concerns, the Fed also stated that it will conclude its quantitative tightening (QT) or balance sheet reduction program on December 1st. The Fed’s balance sheet has declined by more than $2.2 trillion during the course of this round of QT. However, the Fed will continue to allow mortgage-backed securities (MBS) to mature but reinvest those funds into Treasuries, which will allow the Fed to reduce net holdings of MBS while holding the size of the total balance sheet relatively constant. The Fed may also, in the future, reduce long-duration holdings in favor or more short-term debt. This presents a mixed view of possible impacts on mortgage interest rates from balance sheet actions. Current macro indicators, limited by data availability, present a cloudy or mixed picture. Layoffs are increasing. The two-year Treasury rate remains below the federal funds rate, suggesting ongoing tight policy. However, inflation remains above the Fed’s 2% target, stock and asset values continue to rise, and there are positive economic expectations from tax changes like expensing for business investment. Tariffs were not mentioned in the today’s statement, although Fed Governor Waller’s view that tariff impacts on domestic prices are likely to be one-off impacts has received more attention among market analysts and monetary policymakers. With respect to housing supply, in contrast to movement for long-term rates, the reduction of the federal funds rate will have a direct, beneficial effect on interest rates for acquisition, development and construction (AD&C) loans, the key financing channel for private builders who build more than 60% of single-family homes. This will reduce lending costs for builders across the nation and enable more attainable supply. Going forward, if labor market conditions continue to weaken, the Fed will continue to ease – at some point. However, future cuts are likely to be more hotly debated given the current rate of inflation. Chair Powell noted that there is “no risk free path for policy” in this kind of environment. Amid bifurcated market signals and economic conditions (particularly with respect to differentiated high income and low income consumer spending patterns), the vote at the December meeting will be contested. And the ongoing lack of data may cause the Fed to move more slowly as a precaution. Discover more from Eye On Housing Subscribe to get the latest posts sent to your email.

The Fed Cuts amid Partly Cloudy Conditions2025-10-29T14:19:05-05:00

Non-Conventional Financing for New Home Sales Loses Ground in 2024

2025-10-20T09:15:39-05:00

Nationwide, the share of non-conventional financing for new home sales accounted for 31% of the market per NAHB analysis of the 2024 Census Bureau Survey of Construction (SOC) data. This is 1.7 percentage point lower than the 2023 share of 32.4%. As in previous years, conventional financing dominated the market at 69.3% of sales, higher than the 2023 share of 67.6%. Non-conventional forms of financing (as opposed to conventional mortgage loans) include loans insured by the Federal Housing Administration (FHA), VA-backed loans, cash purchases and other types of financing such as the Rural Housing Service, Habitat for Humanity, loans from individuals, or state or local government mortgage-backed bonds. The reliance on non-conventional forms of financing varied across the United States, with its share at almost 40% in the East North Central division but only 24% of new single-family home starts in the South Atlantic division. Nationwide, cash purchases were the majority share of non-conventional financing of new home purchases, accounting for 13% of the market share, slightly down from 14% in 2012. However, a NAHB survey based on builders reported that for 2024, all-cash sales were a higher share at 22%. Meanwhile, the Census reported FHA-backed loans accounted for 11% in 2024, whereas in 2023, they had a 12%market share. The share of VA-backed loans was at 4% market share in 2024, while Other Financing was 3% of market share. Regionally, cash financing held the highest share in the East North Central division, where 27% of all homes started were purchased with cash. Cash purchases led non-conventional financing in five out of nine census regions with27% in East North Central, 23% in New England, 21% in East South Central, 16% in Middle Atlantic, and 15% in West North Central. FHA-backed loans accounted for the majority of all non-conventional financing in the West South Central division, accounting for 20% homes started. In New England, very few homes used FHA-backed loans at just _%, along with the East South Central division at just 1% of homes started. VA-backed loans were most used in the West North Central division, accounting for 10% of non-conventional forms of financing. Notably, in New England, only 1% of the homes started used VA-backed loans in 2024. Other financing such as the Rural Housing Service, Habitat for Humanity, loans from individuals, state or local government mortgage-backed bonds were highest in the East South Central division where it was collectively 14% of market share, while the Mountain division reported the lowest share at 1%. Discover more from Eye On Housing Subscribe to get the latest posts sent to your email.

Non-Conventional Financing for New Home Sales Loses Ground in 20242025-10-20T09:15:39-05:00

Refinancing Activity Surges in September

2025-10-08T10:21:02-05:00

Refinancing activity surged in September, marking the largest monthly increase since the COVID-era of ultra-low interest rates. This increase followed mortgage rates dropping below 6.5% for the first time since October 2024 in anticipation of rate cuts that ultimately materialized. ­­­ The Mortgage Bankers Association’s (MBA)1 Market Composite Index, a measure of total mortgage application volume, rose 29.7% from August on a seasonally adjusted basis and was 29.6% higher than a year ago, the sharpest monthly gain since 2020. The average contract interest rate for 30-year fixed mortgages fell 27 basis points to 6.42%, the lowest in one year. Amid lower borrowing costs, homeowners seized the opportunity to refinance, driving a 54.2% increase in refinancing activity. Purchase applications also increased 7.7% month-over-month. Compared to a year ago, purchase and refinance applications were up 18.6% and 39.8%, respectively. Lower rates are unlocking activity in the housing market, reflected by these increases in mortgage activity. Alongside the jump in refinancing activity, the average refinance loan size increased 22.3% to $410,000, the largest monthly increase since the MBA began tracking in 2011. These coincided with one another, as homeowners with larger loans were the first to take advantage of these lower rates. Purchase loan sizes also increased 1.6% over the month to $436,000, and adjustable-rate mortgage (ARM) loans increased 4.0% to $984,000. The average loan amount across all loan types increased 9.2% to $423,000. The MBA posts weekly mortgage activity data; this analysis averages the weekly data to a monthly frequency. Discover more from Eye On Housing Subscribe to get the latest posts sent to your email.

Refinancing Activity Surges in September2025-10-08T10:21:02-05:00

State/Local Property Tax Revenue Share Falls for Third Straight Quarter

2025-09-26T08:18:57-05:00

In the second quarter of 2025, property tax revenue for state and local governments recorded a new high, although it decreased as a share of total tax revenue. . On a seasonally adjusted basis, state and local government property tax revenue grew 0.7% over the quarter, according to the Census Bureau’s quarterly summary of state and local tax revenue. Meanwhile, total tax revenue for state and local governments increased 1.6% over the quarter, with individual income tax revenue up 4.1%, sales tax revenue up 0.8% and corporate income tax revenue up 0.5%. Property tax revenue stood at $203.4 billion in the second quarter, a slight increase from a revised $202.0 billion estimate in the first quarter. These collections increased 2.5% from one year ago. While this shows growth over the quarter, the share of state and local governments tax revenue originating from property tax fell for the third consecutive quarter. The share is down from its recent peak of 38.0% in the third quarter of 2024 to 37.2%, a 0.8 percentage point decline. Property taxes typically make up the largest share of the total tax revenue for state and local governments, accounting for over one-third at 37.2% in the second quarter. The second highest generator was sales tax at 27.5%, totaling $150.0 billion, followed closely by individual income tax at 26.9% ($146.9 billion). Corporate income tax rounded out the remaining 8.4% at $45.8 billion. Discover more from Eye On Housing Subscribe to get the latest posts sent to your email.

State/Local Property Tax Revenue Share Falls for Third Straight Quarter2025-09-26T08:18:57-05:00

Mortgage Rates Continue Downward Trend in September

2025-09-25T16:19:06-05:00

Average mortgage rates in September trended lower as the bond market priced in expectations of rate cuts by the Federal Reserve. According to Freddie Mac, the 30-year fixed-rate mortgage averaged 6.35%, 24 basis points (bps) lower than August. Meanwhile, the 15-year rate declined 21 bps to 5.50%. Despite the recent drop, rates remain higher than a year ago as last September saw the lowest levels in about two years. The 30-year rate is currently higher by 17 basis points (bps), and the 15-year rate is higher by 24 bps, year-over-year. The 10-year Treasury yield, a key benchmark for long-term borrowing, averaged 4.14% in September – a 15 bps decrease from the previous month. Markets began pricing in rate cuts from the Fed at the start of the month, particularly after news that jobless claims rose while inflation remained modest. On September 17, the Federal Reserve announced a 25 bps cut to the federal funds rate, bringing the target range to 4.00% – 4.25%. Falling mortgage rates have already shown an impact on housing activity. New single-family home sales in August jumped 20.5% from the previous month, although we believe that estimate will be revised lower. Furthermore, according to the latest Mortgage Bankers Association (MBA) report, mortgage application activity strengthened, with refinancing applications rising and purchase applications remaining solid. Discover more from Eye On Housing Subscribe to get the latest posts sent to your email.

Mortgage Rates Continue Downward Trend in September2025-09-25T16:19:06-05:00

Single-Family Construction Loan Volume Falls Back

2025-09-24T08:17:10-05:00

The NAHB Land Acquisition, Development and Construction (AD&C) loan survey in the second quarter reported tightening credit conditions for builders. Consequently, FDIC data reporting the outstanding volume of 1-4 family construction loans fell in the second quarter. The total volume of all AD&C loans fell for the sixth straight quarter, led by declines in other real estate development loans. In the second quarter of 2025, the total level of outstanding acquisition, development, and construction loans fell to $469.1 billion, down 5.3% from one year ago. This was again led by a drop in other real estate development loans, which fell to $379.3 billion, down 2.3% compared to the quarter prior. The volume of 1-4 family residential construction and land development loans totaled $89.8 billion in the second quarter, down 2.0% from one year ago. On a quarterly basis, this volume is down 0.3% from $90.0 billion in the first quarter. It is worth noting, the FDIC data represent only the stock of loans, not changes in the underlying flows, so it is an imperfect data source. Nonetheless, lending remains much reduced from years past. The current amount of existing 1-4 family residential AD&C loans now stands 56% lower than the peak level of residential construction lending of $204 billion reached during the first quarter of 2008. Alternative sources of financing, including equity partners, have supplemented this capital market in recent years. Quality Metrics of Construction Loans As the volume of outstanding 1-4 family residential construction loans fell, the volume of loans 30+ days past due or nonaccrual status also fell. The total level of past due and nonaccrual loans was $1.1 billion, down from $1.2 billion the quarter prior. As a share of the total 1-4 family residential construction loan volume, this accounts for 1.2%. The level of loans in nonaccrual status was $572.1 million while the level for 30-89 past due was $469.2 million. Loans are classified as nonaccrual when one or more of the following conditions apply: the loan is 90 days or more past due on principal or interest (unless it is well-secured and in the process of collection); the bank no longer expects full repayment of principal and interest; or the borrower’s financial condition has significantly deteriorated, warranting cash-basis accounting. Discover more from Eye On Housing Subscribe to get the latest posts sent to your email.

Single-Family Construction Loan Volume Falls Back2025-09-24T08:17:10-05:00

The Fed Cuts and Projects More Easing to Come

2025-09-17T15:15:58-05:00

After a monetary policy pause that began at the start of 2025, the Federal Reserve’s monetary policy committee (FOMC) voted to reduce the short-term federal funds rate by 25 basis points at the conclusion of its September meeting. This move decreased the target federal funds rate to an upper rate of 4.25%. Economically, the cut is justified given signs of a softening labor market and moderate inflation readings. However, Chair Powell characterized today’s easing as a “risk management cut,” rather than one driven by fundamental changes in the economic outlook. NAHB is forecasting another 75 basis points of easing in the coming quarters, with 25 of that total coming before the end of the calendar year. The Fed announced no changes to its ongoing balance sheet reduction policy. While the Fed is easing on the short-end of the yield curve, the ongoing quantitative tightening (QT) program is still exerting upward pressure on mortgage interest rates and is partially responsible for the elevated spread of mortgage rates over the 10-year Treasury rate. The Fed’s balance sheet has contracted from almost $9 trillion in May 2022 to $6.6 trillion in September. A hypothetical slowing of QT for mortgage-backed securities would reduce mortgage interest rates, perhaps by 25 basis points. The Fed summarized current economic conditions as follows: “Recent indicators suggest that growth of economic activity moderated in the first half of the year. Job gains have slowed, and the unemployment rate has edged up but remains low. Inflation has moved up and remains somewhat elevated.” The FOMC statement also indicated that uncertainty about the outlook remains “elevated.” Given the size of recent employment revisions, it might be worth noting that both the outlook and some of the current data reporting is uncertain. Chair Powell noted in his press conference that activity in the housing market remains “weak,” consistent with recent data for the home building sector. He also noted that “housing was at the center monetary policy.” Powell once again noted that a housing shortage exists that lies beyond monetary policy, alluding to the challenges builders face from issues like regulatory cost burdens. The September FOMC policy decision was expected by markets, given recent communication from the Fed, including Chair Powell’s remarks at the Jackson Hole monetary policy conference. For this reason, much of the effect of today’s decision was already priced into long-term interest rates, including a decline for the average of the 30-year fixed rate mortgage. This rate has declined by 20 basis points to 6.35% over the last month, per Freddie Mac. In fact, the 10-year Treasury rate barely moved in response to today’s announcement. A growing risk for long-term rates, including mortgage rates, comes from federal government debt and deficits. In contrast to movement for long-term rates, the reduction of the federal funds rate will have a direct, beneficial effect on interest rates for acquisition, development and construction loans, the key financing channel for private builders who build more than 60% of single-family homes. This will reduce lending costs for builders across the nation and enable more attainable supply. There was considerably more internal drama entering today’s FOMC decision. Besides marking a resumption of Fed easing, today’s meeting featured newly installed Fed Governor Stephen Miran and the participation of embattled Governor Lisa Cook. It is worth noting that Miran was the only dissenter at today’s meeting. Instead of voting for a 25-basis point cut, Miran preferred a 50-basis point reduction. That said, today’s decision featured less division among the FOMC voting members than some analysts expected, which is a positive with respect to the Fed’s independence. A revised Summary of Economic Projections (SEP) was also published today. The SEP provides a view of Fed Governors’ and Federal Reserve Bank Presidents’ outlook for economic conditions, inflation expectations and future monetary policy actions (only 12 of the 19 SEP respondents are voting members at each meeting). While there was little dissension in today’s FOMC policy decision, the SEP reveals considerable disagreement for the outlook. Seven SEP respondents projected no additional cuts for the remainder of the year. Twelve projected more cuts. The median projection suggests two more rate cuts for 2025. One respondent, most likely Governor Miran, provided an outlook of five more 25 basis point cuts before the end of 2025. On a median basis, the Fed sees weaker economic growth ahead. The SEP reports a 1.6% GDP growth rate (measuring the 4th quarter to 4th quarter change) for 2025, 1.8% in 2026 and 1.9% in 2027. The SEP projection reports only small increase in the unemployment rate, with a peak rate ahead of 4.5% ahead. For the median SEP respondent, the economy is not seen as reaching the target 2% core CPE inflation rate until 2028. It is worth noting that prior editions of the SEP also saw this target as effectively two years away. Nonetheless, while taking longer than previously expected, the otherwise declining trend for expected inflation in the years ahead suggests the Fed sees any possible tariff effects on inflation will be one-off or otherwise limited, as Governor Waller in particular has explained. Overall, today’s decision was widely expected. Much of the benefit of today’s easing was already priced into long-term interest rates, but the rate cut will benefit business loan finance conditions. Further, additional rate cuts lie ahead, although as Chair Powell noted, “policy is not on a pre-set course.” Future Fed actions will depend on incoming data and the evolving policy environment. Discover more from Eye On Housing Subscribe to get the latest posts sent to your email.

The Fed Cuts and Projects More Easing to Come2025-09-17T15:15:58-05:00

Purchase Activity Slips Despite Lower Mortgage Rates

2025-09-08T11:21:07-05:00

Mortgage application activity increased again in August, supported by lower interest rates. The Mortgage Bankers Association’s (MBA) Market Composite Index, a measure of total mortgage application volume, rose 5.0% from July on a seasonally adjusted basis and was 18.3% higher than a year ago. The average contract interest rate for 30-year fixed mortgages fell 13 basis points to 6.70%, the lowest level since November. Despite the decline, purchase applications slipped 3.0% month-over-month, while refinancing activity rose 15.6%. Compared to August 2024, purchase and refinance applications were up 19.4% and 16.9%, respectively. Loan sizes posted mixed results. The average loan amount across all loan types increased 2.7% to $386,600. Purchase loan sizes edged up 0.1% to $429,200, while the average refinance loan size jumped 11.8% to $334,600. The average size of adjustable-rate mortgage (ARM) loans decreased 1.3% to $957,500 from $945,200. Discover more from Eye On Housing Subscribe to get the latest posts sent to your email.

Purchase Activity Slips Despite Lower Mortgage Rates2025-09-08T11:21:07-05:00

Mortgage Rates Move Lower, Hitting 10-Month Low

2025-08-28T14:15:42-05:00

Average mortgage rates in August continued their steady decline and are now at their lowest rate since last November. According to Freddie Mac, the 30-year fixed-rate mortgage averaged 6.59%, 13 basis points (bps) lower than July. Meanwhile, the 15-year rate declined 15 bps to 5.71%. Compared to a year ago, the 30-year rate is higher by 9 basis points (bps), and the 15-year rate is marginally higher by 3 bps. The 10-year Treasury yield, a key benchmark for long-term borrowing, averaged 4.29% in August – an 8 bps decrease from the previous month. Yields moved unevenly during the month: initially declining, then rising following July’s inflation report that noted an acceleration in core inflation. Long-term yields subsequently retreated following Federal Reserve Chair Jerome Powell’s Jackson Hole speech last Friday, where he signaled possible rate cuts. Powell noted that the downside risk to employment is on the rise while inflation expectations are well-anchored around the Fed’s longer-run target of 2%. Recently, President Trump sought to fire Federal Reserve Governor Lisa Cook, alleging she submitted fraudulent information on mortgage applications. Cook has since filed a lawsuit to block her dismissal, arguing that the president lacks authority to remove a Fed governor without cause. The case underscores ongoing concerns about the central bank’s independence from political influence. Separately, former Federal Reserve Governor Adriana Kugler resigned earlier this month to return to academia, creating a vacancy on the Board of Governors for the President to fill. Both Cook and Kugler were nominated by President Joe Biden. Discover more from Eye On Housing Subscribe to get the latest posts sent to your email.

Mortgage Rates Move Lower, Hitting 10-Month Low2025-08-28T14:15:42-05:00

Credit Conditions for Builders Tighten

2025-08-15T08:16:00-05:00

For the fourteenth consecutive quarter, builders and developers reported tighter credit conditions on loans for residential Land Acquisition, Development & Construction (AD&C) in NAHB’s quarterly survey on AD&C Financing.   In the second quarter of 2025, the NAHB survey’s net easing index posted a reading of -12.3 (the negative number indicating that credit tightened since the previous quarter).  This is in reasonably close agreement with the second quarter reading of -9.7 for the similar net easing index derived from the Federal Reserve’s survey of senior loan officers.  Like the NAHB net easing index, the one from the Fed has been in negative territory (indicating credit tightening) for fourteen consecutive quarters.  Over the past year the additional tightening indicated by both indices has been relatively modest, with index levels hovering between -20 and 0.  Modest or not, however, after fourteen straight quarters of tightening, many builders are probably wondering how much room lenders have left to tighten further.     More details from the Fed’s survey of lenders—including measures of demand and net easing for residential mortgages—appeared in a previous post. According to NAHB builders, the most common ways lenders tightened credit on AD&C loans in the second quarter were by reducing the amount they are willing to lend (cited by 60% of the builders who reported tighter credit), requiring personal guarantees (53%), increasing the interest rate and not making new loans (47% each), and increasing documentation requirements (40%).  Also in the second quarter, the cost of credit declined on loans made specifically for residential land acquisition (the “A” in AD&C).  The average contract interest rate on the loans declined from 8.23% to 7.82%, while the average initial points dropped from 0.71% to 0.56%.  As a result, the average effective interest rate (which takes both the contract rate and initial points into account) on land acquisition loans declined from 10.68% to 9.95%. For the other three categories of AD&C loans tracked in the NAHB survey, credit became more expensive since the previous quarter.  The average contract interest rate increased on loans for land development (from 7.86% to 8.04%) and speculative single-family construction (from 8.08% to 8.17%), while declining only slightly (from 7.96% to 7.95%) on loans for pre-sold single-family construction.  Meanwhile, average initial points were unchanged at 0.74% on loans for land development, but increased from 0.68% to 0.72% on loans for speculative single-family construction, and from 0.45% to 0.58% on loans for pre-sold single-family construction. Those combinations of quarter-to-quarter changes took the effective interest up from 11.50% to 11.77%  on loans for land development, from 12.59% to 12.82% on loans for speculative single-family construction, and from 12.49% to 12.73% on loans for pre-sold single-family construction. Although the average effective interest rate was higher in 2025 Q2 than in 2025 Q1 for three of the four categories of AD&C loans, the rate was down year-over-year for all four.  Financing costs for builders and developers could decline further over the next quarter, especially if (as NAHB expects) the Federal Reserve reduces the target federal funds rate at its September meeting.  In fact, as discussed in NAHB’s post on the Fed’s July meeting, a reduction in construction financing costs rather than an effect on mortgage rates is the main benefit builders can expect from easier monetary policy. More detail on credit conditions for residential builders and developers is available on NAHB’s AD&C Financing Survey web page. Discover more from Eye On Housing Subscribe to get the latest posts sent to your email.

Credit Conditions for Builders Tighten2025-08-15T08:16:00-05:00

About My Work

Phasellus non ante ac dui sagittis volutpat. Curabitur a quam nisl. Nam est elit, congue et quam id, laoreet consequat erat. Aenean porta placerat efficitur. Vestibulum et dictum massa, ac finibus turpis.

Recent Works

Recent Posts