How COVID-19 Reshaped the U.S. Labor Market and Housing Demand
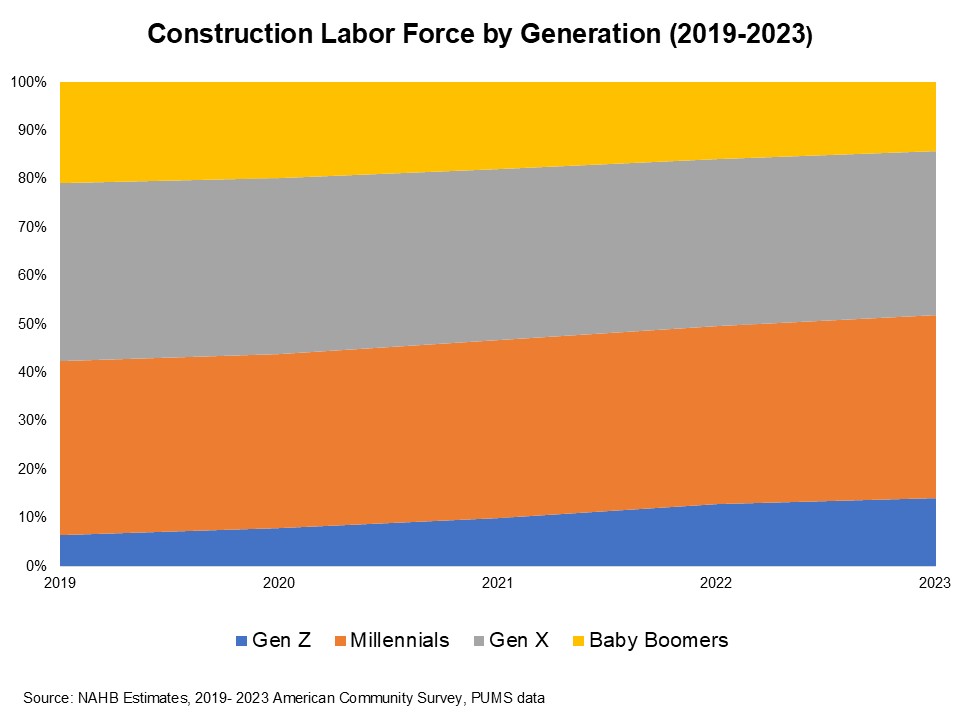
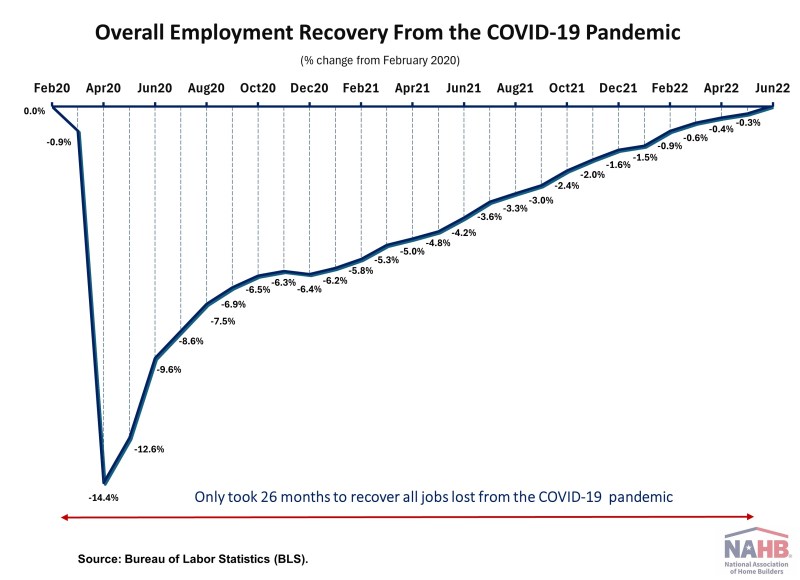
Web Master2025-10-22T09:19:14-05:00Between February 2020 and June 2022, the U.S. labor market experienced the deepest downturn on record followed by the fastest recovery in at least a century. The COVID-19 pandemic disrupted every corner of the economy, forcing massive shutdowns and triggering record job losses across all industries. Yet, in just two years, the labor market rebounded with remarkable speed, marking a historic recovery that continues to reshape both employment trends and the broader economy. Overall Employment Recovery At the beginning of 2020, the U.S. economy was enjoying a “Goldilocks” moment at the end of Trump’s first term with the longest continuous stretch of job growth on record. The unemployment rate remained near a 50-year low of 3.5%, job openings were steady, and wage growth was modestly outpacing inflation. Then, the COVID-19 pandemic struck, reshaping the labor market dramatically. In April 2020 alone, the U.S. lost roughly 20.5 million jobs—an unprecedented drop since data collection began in 1939—bringing total nonfarm payroll employment to its lowest level since February 2011. By the end of that spring, the economy shed nearly 22.9 million jobs due to shutdowns and restrictions. Meanwhile, the unemployment rate soared to 14.8% in April 2020, the highest level since the Great Depression. This recession was not only the deepest in U.S. history but also the fastest to recover. It took just 26 months for overall employment to return to pre-pandemic levels—a speed unmatched by any previous downturn. In February 2020, total employment stood at 152.3 million but plunged 14.4% to 130.4 million by April. From there, the labor market rebounded relentlessly, surpassing the February 2020 level to reach 152.4 million by June 2022. Notably, May 2020 saw the largest monthly job gain on record, signaling the beginning of a historic recovery. Uneven Industrial Recoveries While the overall U.S. labor market made a remarkable recovery from the historic COVID-19 downturn, the path of recovery varied widely across industries. Among all the major industries, the leisure and hospitality sector was hit the hardest, losing approximately 8.2 million jobs—nearly half their workforce—in just two months. However, by August 2025, this sector had not only fully recovered but exceeded its pre-pandemic employment level. Other major industries that experienced significant job losses include health care and social assistance (down by nearly 2.3 million jobs), retail trade (2.27 million), and professional and business services (2.26 million). All of these sectors have not only recovered but also expanded beyond their pre-pandemic employment levels by August 2025. Government employment, although not driven by market forces and constraints, declined by about 1.46 million jobs but has rebounded to 103% of its pre-pandemic size. Construction, another vital sector, lost around 1.09 million jobs but has experienced a robust recovery, now standing at 109% of the February 2020 level. However, not all sectors have bounced back fully. Manufacturing, especially in durable goods, remains just shy of full recovery, at 99% of its pre-pandemic employment level after losing 933,000 jobs. The mining and logging sector, which lost 145,000 jobs, continues to lag, with employment still at just 89% of its February 2020 level. These industries continue to face challenges in returning to their pre-pandemic workforce size. Meanwhile, several sectors, such as private educational services, transportation and warehousing, non-durable goods manufacturing, wholesale trade, information, financial activities, and utilities, all experienced smaller job losses relative to the hardest-hit industries and have now surpassed their pre-pandemic employment levels, with transportation and warehousing showing the strongest rebound at 117% of the February 2020 level. From Job Market to Housing Market: Pandemic Reshapes Housing Market The labor market recovery has occurred alongside a broader reshaping of household behavior, particularly around how and where Americans live. As lockdowns and remote work kept people home, the share of expenditures devoted to at-home consumption rose sharply. This shift had profound effects on housing demand. In response to the COVID-19 pandemic, the Federal Reserve lowered the federal funds rate to a target range of 0% to 0.25% in March 2020 and remained at this historically low level for nearly two years to stimulate borrowing and spending to support the economy. Fueled by historically low interest rates, the housing market experienced an unprecedented surge. Sales of both new and existing single-family homes soared. New home sales peaked at more than 160% of 2019 levels by mid-2020, while existing home sales also rose sharply. However, as inflationary pressures grew, the Federal Reserve began raising rates aggressively in 2022. This tightening cycle significantly cooled the housing market, particularly for existing homes. Existing home sales fell below pre-pandemic levels and continued to trend downward through 2025. In contrast, new home sales—while volatile—generally remained above 2019 levels in the past two years. A shortage of resale inventory, coupled with homeowners hesitant to give up locked-in low mortgage rates, led many buyers to turn to new construction despite elevated interest rates. Looking Ahead: Easing Rates and a Potential Market Rebound In recent months, there have been signs of a potential rebound in the housing market. Following the Federal Reserve’s rate cut in September 2025, mortgage rates fell below 6.5% for the first time this year. As of last week, the average 30-year fixed mortgage rate had dropped to 6.27%. With additional Fed rate cuts expected in the coming quarters, lower borrowing costs and improving inventory levels could stimulate housing market activity on both the buying and selling sides of the industry. Discover more from Eye On Housing Subscribe to get the latest posts sent to your email.