What Percentage of the Housing Market Are Teardowns?
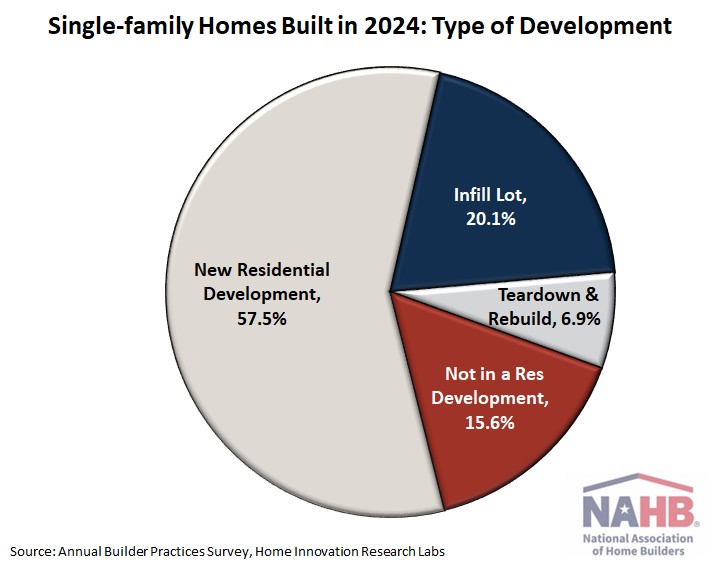
Diana Carroll2025-12-03T10:14:11-06:00In 2024, 6.9% of new single-family detached homes were teardowns (structures torn down and rebuilt in older neighborhoods), and another 20.1% were built on infill lots in older neighborhoods, according to the latest Builder Practices Survey (BPS) conducted by Home Innovation Research Labs.