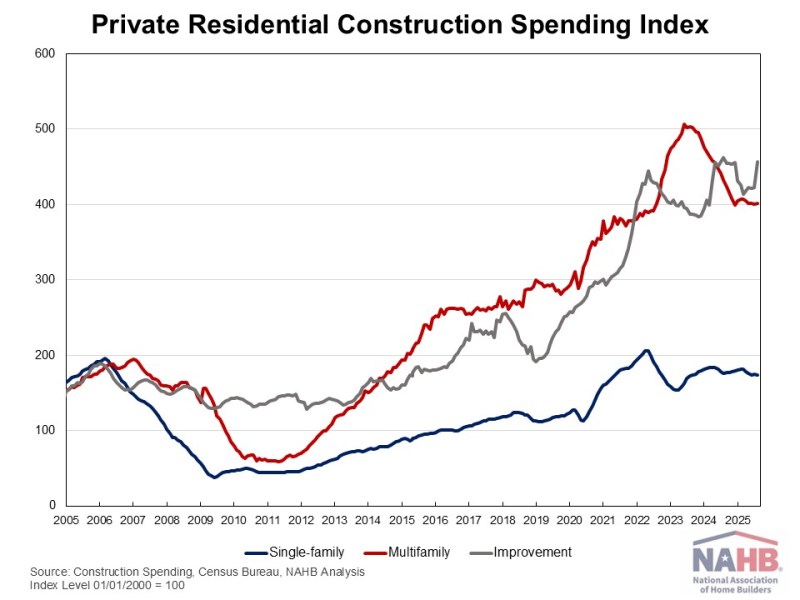
The New Frontier of Jobsite Efficiency: How Flat-Packed Door Systems Are Transforming Installs

2025-11-19T13:16:29-06:00

Pre-hung doors have long been the default choice for builders and remodelers. But with their benefits, they also come with logistical downsides. More builders are turning to a new alternative: flat-packed, “knocked-down” door systems that ship efficiently and assemble cleanly on-site.

The New Frontier of Jobsite Efficiency: How Flat-Packed Door Systems Are Transforming Installs2025-11-19T13:16:29-06:00

Location, Location, Location: How Place and Neighborhood Shape Home Values

2025-11-18T10:14:57-06:00

The value of a single-family home depends not only on its physical features but also on its location and neighborhood context. In this second part of our two-part series, we examine how geography and neighborhood quality further influence single-family detached home values across the United States. Not surprisingly, location remains one of the strongest drivers of home values (Figure 2). Homes in a big metropolitan area are valued 60% higher than comparable homes in non-metro areas, while those in smaller or midsized metro areas are 22% more. Home values also vary significantly across Census Divisions. Using New England as the baseline, homes in the Pacific Divisions, including Alaska, California, Hawaii, Oregon, and Washington, are valued around 35% higher values on average. By contrast, homes in the rest of the divisions show substantially lower values relative to New England. Homes in the East South Central and West South Central divisions are more than 60% lower in value, while those in the Middle Atlantic are about 30% lower. In the East North Central and West North Central Divisions, home values are roughly 47% and 46% lower, respectively. Homes in the South Atlantic are 39% lower, and those in the Mountain Division are about 19% lower. People are willing to pay a premium for a better neighborhood. This analysis shows that a higher overall neighborhood quality rating, measured on a 1 to 10 scale, contributes about a 2% increase in home value for every 1-point rise (Figure 3). For example, moving from a neighborhood rated 5 to one rated 7 could increase your home value by 4%. On the other end, the impact of specific negative conditions is substantial (Figure 4). Homes located near abandoned or vandalized buildings have 17% lower values. Additionally, the presence of visible trash nearby reduces home values by 8%. Improving the broader neighborhood environment could have as much impact on the final home value as upgrades inside the home. Please click here to be redirected to the full special study.

Location, Location, Location: How Place and Neighborhood Shape Home Values2025-11-18T10:14:57-06:00

August Private Residential Construction Spending Edges Higer 

2025-11-17T11:14:28-06:00

Private residential construction spending inched up 0.8% in August, continuing steady growth since June 2025. This modest increase was primarily driven by more spending on multifamily construction and home improvements. However, total spending was 2% lower than a year ago, as the housing sector continues to navigate the economic uncertainty stemming from ongoing tariff concerns and elevated mortgage rates.  According to the latest U.S. Census construction spending data, single-family construction spending slipped 0.4% in August, in line with the soft builder sentiment reflected in the August NAHB/Wells Fargo Housing Market Index (HMI). Compared to a year ago, single-family construction spending decreased by 1.1%. Improvement spending (remodeling) posted a solid 8.2% gain for the month, but it remained 1.3% lower than in August 2024. The remodeling sector continues to show resilience, supported by strong homeowner equity and persistent demand for home improvements. Meanwhile, multifamily construction spending rose 0.2% in August, marking a pause in the downward trend that began in mid-2023. Compared to a year earlier, multifamily spending was down 7.1%.   The NAHB construction spending index is shown in the graph below. The index illustrates how   spending on single-family construction has slowed since early 2024 under the pressure of elevated interest rates and concerns over building material tariffs. Multifamily construction spending growth has also slowed down after the peak in July 2023. Improvement spending has also been weakening since the beginning of 2025.  Spending on private nonresidential construction was down 4% over a year ago. The annual private nonresidential spending decrease was primarily driven by a $20 billion drop in manufacturing construction spending, followed by a $11 billion decrease in commercial construction spending.

August Private Residential Construction Spending Edges Higer 2025-11-17T11:14:28-06:00

About My Work

Phasellus non ante ac dui sagittis volutpat. Curabitur a quam nisl. Nam est elit, congue et quam id, laoreet consequat erat. Aenean porta placerat efficitur. Vestibulum et dictum massa, ac finibus turpis.

Recent Works

Recent Posts