Median Age of Construction Labor Force Holds at 42
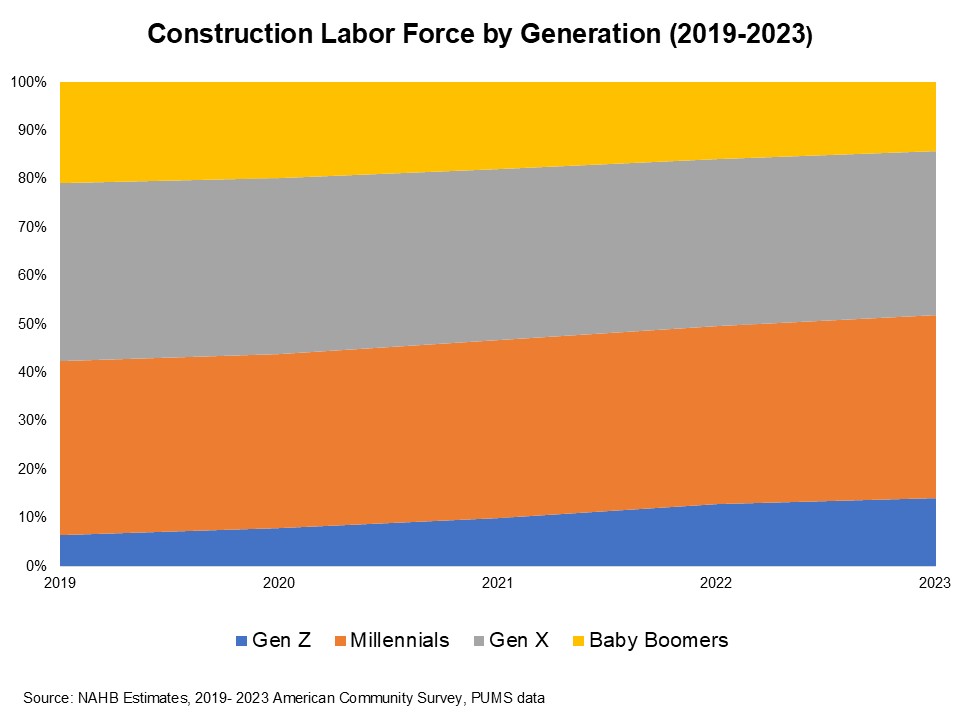
Web Master2025-10-21T09:15:17-05:00The median age of construction labor force is 42, one year older than a typical worker in the national labor force, according to NAHB analysis of the most recent 2023 American Community Survey (ACS) data. However, more younger people are joining the construction industry. Despite some improvements since the peak of the skilled labor shortage in 2021, attracting skilled labor remains the primary long-term goal for the construction industry. The median age of construction labor force varies across states. The color coding in the map below tracks the median age of people working in the construction industry. The state with the oldest median age (46 years old) is Alaska, followed by Connecticut and Maine, where the median age of workers in construction is 45. Construction labor force is younger on average in the central part of the nation. For example, half of all people working in construction in Utah are under 39. The second data series mapped above is the difference between the median age of workers in construction in each state and the median age of all industry workers. These estimates are reported as the numbers printed on each state. A positive number indicates that on average, people in construction are older than a typical worker in the state labor force. Alaska has the largest difference, where the median age of construction labor force is 6 years higher than the overall median in the state. On the other hand, a negative number indicates the construction labor force is, in general, younger than the state labor force. In Vermont and Delaware, the median age of workers in construction is 2 years younger than the overall median. Analysis of the age distribution of workers in construction over time reveals that Gen Z, those born between 1997 and 2012, are more likely to enter the construction industry than Millennials, when they were the youngest generation in the labor force. They are drawn to careers in the construction industry due to factors such as new innovations in modern construction technologies, high costs of college education, competitive wages in construction, job security and potential for growth. Generational shifts are reshaping the construction labor force. The share of Gen Z has more than doubled, increasing from 6.4% in 2019 to 14.1% in 2023, reflecting a growing pipeline of younger workers. Millennials’ share also rose from 35.7% to 37.7% over the same period. In contrast, Gen X declined from 36.6% to 33.7%, while Baby Boomers fell sharply from 20.6% to 14.2% as workers moved to retirement. The chart below shows that, as of 2023, only about 14.1% of construction labor force were Gen Zers. Around 71% of the construction labor force were Millennials and Gen-Xers, who are considered in their prime working years, compared to 66% in overall labor force. The relative greater share of Gen X construction labor force reveals the current challenge of the labor shortage. Gen X is a smaller generational group than the Baby Boomers. The share of Baby Boomer construction labor force is 14.2%, implying that a substantial portion of the labor force will retire in the near future. Attracting more skilled labor, especially younger generations, remains the primary long-term goal for the construction industry. Discover more from Eye On Housing Subscribe to get the latest posts sent to your email.