Who are NAHB Associate Members?
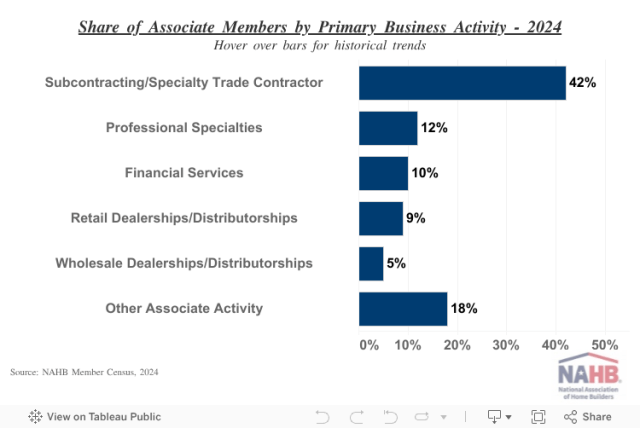
Web Master2025-09-19T08:19:23-05:00Every year since 2008, the NAHB has conducted a member census in order to better understand the composition and characteristics of the people who belong to its organization. Similar to a previous post about builder members, NAHB conducted a related analysis of its associate members. In 2024, 65% of NAHB’s members were associate members—those involved in a wide range of support industries and professions including, among others, trade contractors, manufacturers, retailers/distributors, designers, and architects. Of the 71,170 associate members, 42% are primarily subcontractor/specialty trade contractors, 12% have a professional specialty, 10% are in financial services, 9% are retail dealerships or distributorships, 5% are wholesale dealerships or distributorships, and the remaining 18% have some other type of primary activity. In 2024, associate members had a median of 12 employees on payroll, which has been unchanged since 2022. Twenty-three percent of associate members had 1-4 employees, 19% had 5 to 9, 37% (plurality) had 10 to 49, and 19% had 50 or more employees. Two percent had no payroll at all. The median revenue of NAHB associate members was $3.02 million in 2024, a slight increase from $3.00 million in 2023 and the highest in the 17-year history of the Census. In 2024, the median age of NAHB associate members was 56 which has remained constant since 2022. Four percent of associate members were less than 35 years old, 16% were 35 to 44, 25% were 45 to 54, 34% (plurality) were 55 to 64, and 20% were 65 or older. The share of associate members who identify as female stands at 25%, up one percentage point from 2023. For more details about NAHB associate members and a profile of each type of member, please visit housingeconomics.com or click here for the full article. Discover more from Eye On Housing Subscribe to get the latest posts sent to your email.