New Tariffs on Lumber, Wood Product Imports Add Headwinds to Housing Market

2025-09-30T15:15:41-05:00

In a move that will raise housing costs, the U.S. Commerce Department today imposed a 10% tariff on all timber and lumber imports and an additional 25% tariff on kitchen cabinets and furniture after announcing that it found that imports of these materials and products pose a national security risk.

New Tariffs on Lumber, Wood Product Imports Add Headwinds to Housing Market2025-09-30T15:15:41-05:00

Construction Labor Market Softens

2025-09-30T10:20:27-05:00

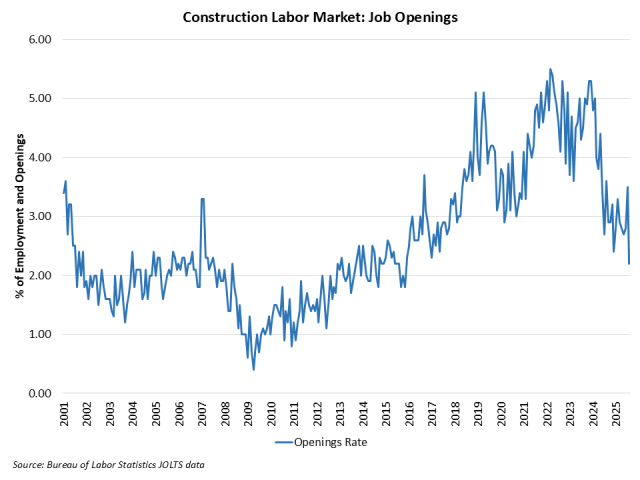
The count of open, unfilled positions in the construction industry decreased in August, per the Bureau of Labor Statistics Job Openings and Labor Turnover Survey (JOLTS). The decline occurred as home building weakened in 2025. The number of open jobs for the overall economy was effectively unchanged, increasing from 7.21 million in July to 7.23 million in August. The August reading was notably lower than the 7.65 million estimate from a year ago and reflects an overall cooling of the U.S employment market. Previous NAHB analysis indicated that this number had to fall below 8 million on a sustained basis for the Federal Reserve to move forward on interest rate reductions. With estimates remaining below 8 million for national job openings, the Fed, in theory, should be able to cut further in 2025. The number of open construction sector jobs decreased from a revised 303,000 level in July to 188,000 in August. This marks a notable decline of open, unfilled construction jobs from that registered a year ago (304,000). The chart below notes the declining trend that has been in place for unfilled construction jobs since the Fed raised the federal funds rate as home building weakened. The construction job openings rate declined to 2.2% in August, lower than the 3.6% estimated a year ago. The layoff rate in construction declined to 2.2% in August. The quits rate edged higher to 1.8% in August. Discover more from Eye On Housing Subscribe to get the latest posts sent to your email.

Construction Labor Market Softens2025-09-30T10:20:27-05:00

Characteristics of Homes Built in Age-Restricted Communities

2025-09-29T09:19:49-05:00

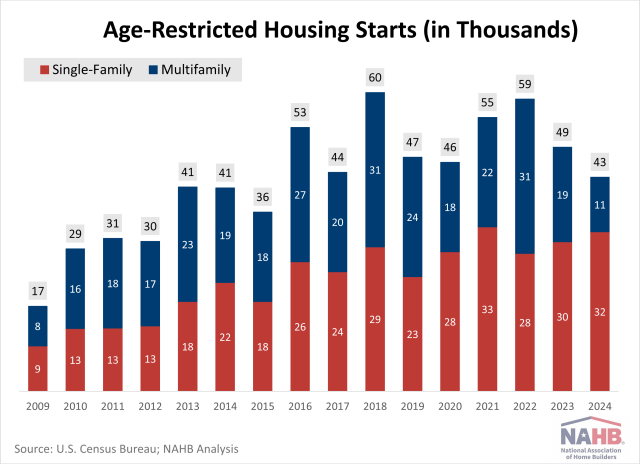
In 2024, approximately 43,000 homes were built in age-restricted communities, representing just over 3% of all housing starts. According to the Census Bureau’s Survey of Construction, roughly three-quarters of these homes (32,000) were single-family units. The remaining 11,000 were multifamily units, which marked the lowest number of age-restricted multifamily starts since 2009. In 2009, during the depths of the housing downturn, builders started only 17,000 homes in age-restricted communities (9,000 single-family and 8,000 multifamily).  The numbers then increased steadily until reaching 60,000 age-restricted starts (roughly evenly split between single-family and multifamily) in 2018. These numbers decreased during the pandemic but rebounded in 2021-2022, almost reaching the peak from 2018. In 2024, the total number of age-restricted home starts decreased by approximately 12% from 2023. This drop came amid a broader slowdown in overall housing starts. While total single-family starts increased by about 7% year-over-year, multifamily starts fell sharply by 25%. A similar trend played out in the age-restricted segment: single-family starts increased, while multifamily starts declined. In terms of market share, age-restricted single-family homes maintained their 3.16% share of all single-family starts, but the share of age-restricted multifamily units fell to 3.11%. Age-restricted single-family homes carried a noticeable price premium in 2024. The median sales price reached $525,000—about 25% higher than the $421,000 median for non-age-restricted homes. While new non-age-restricted home prices held steady compared to the previous year, prices for age-restricted homes rose by 5%. Age-restricted homes tended to be larger, averaging 2,200 square feet versus 2,100 square feet. However, the price per square foot remained elevated at $155.90, compared to $154.30 for non-age-restricted homes. Lot values may help explain part of the price difference. Age-restricted homes were typically built on more expensive lots, with a median value of $62,000 compared to $60,000 for non-age-restricted homes. Despite the higher price, these lots were smaller, averaging 0.16 acres versus 0.20 acres. Additional data from the 2024 SOC reveal that age-restricted homes have distinct characteristics compared to non-age-restricted homes. A higher percentage of age-restricted homes are attached, single-story, and lack a basement. These homes are also more likely to come with patios and porches, but less likely to have decks.  Finally, age-restricted homes are less likely to require a loan and more likely to be purchased for cash, as older home buyers have had longer to accumulate savings and assets (often equity in a previous home) that can be converted into cash. Discover more from Eye On Housing Subscribe to get the latest posts sent to your email.
Characteristics of Homes Built in Age-Restricted Communities2025-09-29T09:19:49-05:00

Podcast: Countdown to Shutdown – Will Congress Act?

2025-09-26T16:17:08-05:00

On the latest episode of NAHB's podcast, Housing Developments, CEO Jim Tobin and COO Paul Lopez discuss the potential of a government shutdown, the latest economic data, and upcoming events NAHB members don't want to miss.

Podcast: Countdown to Shutdown – Will Congress Act?2025-09-26T16:17:08-05:00

2025 Second Quarter State-Level GDP Data

2025-09-26T14:15:02-05:00

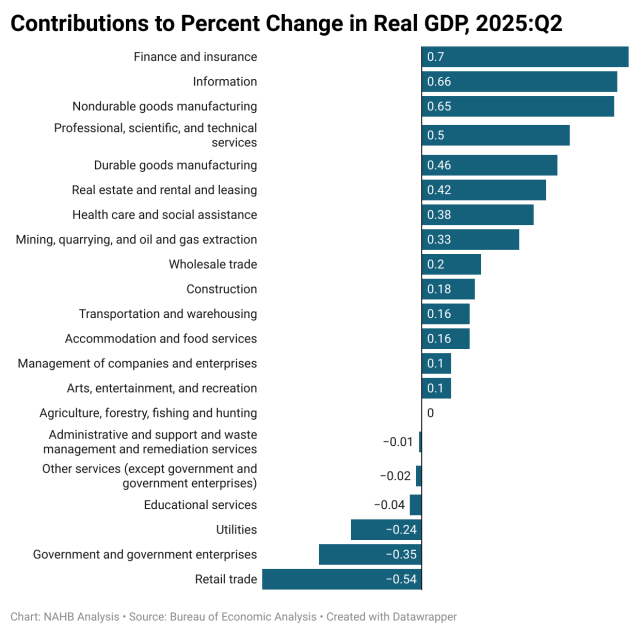
Real gross domestic product (GDP) increased in 48 states in the second quarter of 2025 compared to the first quarter, according to the U.S. Bureau of Economic Analysis (BEA). Mississippi and Arkansas reported declines, while the District of Columbia reported no change during this time. Growth was geographically broad but varied considerably in magnitude, ranging from a 7.3 percent increase in North Dakota to a 1.1 percent decline in Arkansas.   Nationwide, growth in real GDP (measured on a seasonally adjusted annual rate basis) increased 3.8 percent in the second quarter of 2025. The leading contributors to the increase in real GDP across the country were finance and insurance; information; and nondurable-goods manufacturing.      Regionally, real GDP increased in all eight regions between the first and the second quarter of 2025. The percent change in real GDP ranged from a 2.9 percent increase in the Southeast region to a 6.0 percent increase in the Southwest region.           The strong performance in North Dakota, Texas, Kansas, New Mexico, and Wyoming reflected outsized contributions from mining, quarrying, and oil and gas extraction, underscoring the continued importance of the energy sector in driving state-level outcomes. At the same time, finance and insurance, information, and nondurable-goods manufacturing provided steady growth contributions across most regions, supporting broad-based gains. While the majority of states experienced moderate to strong expansion, a small number of states in the South and Midwest posted flat or declining GDP, highlighting ongoing sectoral challenges such as weaker agricultural output, subdued consumer spending, or slower goods production. At the industry level, finance and insurance, information services, and nondurable-goods manufacturing were the most consistent contributors to state-level GDP growth nationwide, while mining and energy extraction provided a particularly strong lift in western and energy-rich states. However, several sectors weighed on growth in specific regions. Agriculture, forestry, fishing, and hunting contracted in parts of the Midwest and Plains, offsetting gains elsewhere and contributing to weaker results in states with heavy reliance on farm output. In addition, durable-goods manufacturing was a mixed performer, with softness in transportation equipment and machinery limiting growth in certain industrial states. The divergence in growth rates illustrates the uneven distribution of economic momentum across the country, shaped largely by differences in industrial composition. Energy-producing states continued to benefit from elevated demand and investment in extraction industries, while states with less exposure to these sectors showed more modest gains. Overall, the data point to an economy that remains resilient at the national level but with significant regional disparities, emphasizing the influence of industry-specific factors on state growth trajectories. Discover more from Eye On Housing Subscribe to get the latest posts sent to your email.
2025 Second Quarter State-Level GDP Data2025-09-26T14:15:02-05:00

Trump Announces New Tariffs on Furniture and Kitchen Cabinets

2025-09-26T13:16:58-05:00

In a move that could raise construction costs, President Trump on Sept. 25 announced he would impose a 50% tariff on imported kitchen cabinets and bathroom vanities, along with a 30% tariff on upholstered furniture, effective on Oct. 1.

Trump Announces New Tariffs on Furniture and Kitchen Cabinets2025-09-26T13:16:58-05:00

About My Work

Phasellus non ante ac dui sagittis volutpat. Curabitur a quam nisl. Nam est elit, congue et quam id, laoreet consequat erat. Aenean porta placerat efficitur. Vestibulum et dictum massa, ac finibus turpis.

Recent Works

Recent Posts