Multifamily Absorption Rises in the Second Quarter
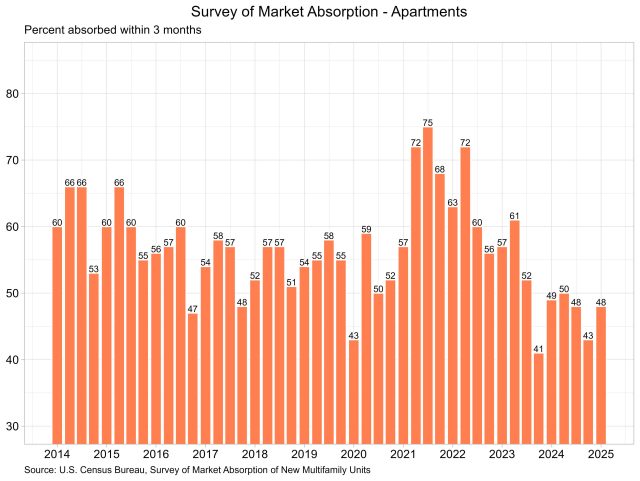
Web Master2025-08-29T08:21:31-05:00The percentage of new apartment units that were absorbed within three months after completion rose in the second quarter, according to the Census Bureau’s latest release of the Survey of Market Absorption of New Multifamily Units (SOMA). The survey covers new units in multifamily residential buildings with five or more units. The number of new multifamily units completed fell for the second consecutive quarter, down to the lowest level since the fourth quarter of 2023. Apartments The percentage of apartments absorbed within three months has fallen significantly from its peak of 75% in the third quarter of 2021, as shown in the graph above. Currently, the rate stands at 48%, meaning that 48% of the 98,520 units completed in the first quarter were rented within three months of completion. The median asking rent in the second quarter was $1,920, up 12.3% from $1,710 a year ago. This marks the second consecutive quarter of record high asking rent in the SOMA survey. Along with the three-month absorption rate and completions, SOMA also reports absorption rates at six, nine, and twelve months after completion. For apartments completed six months ago (124,300 units), 70% have been absorbed into the market. Of the 143,400 apartments completed nine months ago, 81% have been absorbed. For those completed twelve months ago (118,700 units), 91% have been absorbed into the multifamily market. Condominiums and Cooperative Units The three-month absorption rate for new condominiums and cooperative units fell four percentage points to 66%. Total completions of new condominiums and cooperative units, according to the SOMA, fell in the first quarter from 2,902 to 2,639. Completions of these units peaked in the second quarter of 2018 at 7,996 and have steadily fallen since then. Discover more from Eye On Housing Subscribe to get the latest posts sent to your email.